Getting Started
This quick start demonstrates the most important features of DirX Audit and illustrates the typical way to work with DirX Audit in a customer environment. It consists of several nearly independent sections that describe typical DirX Audit use cases.
This quick start consists of several sections:
-
How to analyze aggregated data with the DirX Audit Manager Dashboard view.
-
How to analyze audit events with the DirX Audit Manager Audit analysis.
-
How to analyze history entries of audit events with the DirX Audit Manager History view.
-
How to set up and run DirX Audit reports with the DirX Audit Manager Reports view. For information on how to customize reports, see the DirX Audit Customization Guide.
After performing these quick start sections, you should be able to:
-
Understand and use most of DirX Audit’s powerful features.
Before You Begin
Before you can use the quick start, you must:
-
Install DirX Audit and all of its selectable components on the same machine (no distributed environment). See the DirX Audit Installation Guide for details.
-
Read about basic user interface features in the DirX Audit User Interface Guide.
This tutorial also assumes that you are running the DirX Identity My-Company sample domain and that you can use the My-Company users to log in to DirX Audit Manager. See the DirX Identity Tutorial for details about the My-Company sample domain and its users.
If you are familiar with the DirX Identity Tutorial, which is the original source of data for this tutorial, you can also follow and compare individually performed steps.
Preparing to Use the Tutorial
Before we can proceed with the tutorial, we need to perform the following tasks:
-
Set up the event context calculation
-
Load the sample data (events) from the DirX Identity source
-
Load the sample data (events) from the DirX Access source
-
Load the sample DirX Identity history data
-
Calculate history data foreign keys and sample KPI tables
-
Load the default Dashboard components
Setting up the Event Context Calculation
A context record contains data on the causing event for most audit events. In particular, it holds names of requesters and approvers in approval activities. DirX Audit Server calculates these values regularly. We need to edit the server configuration file for populating context records before loading the sample data so that the data loaded in the next steps are calculated with the correct time scope.
-
Navigate to the tenant route deployment folder
install_path/server_container/tenants/tenantID/deploy/routes/.
Copy the tenant context record calculation route XML file route-dxt-scheduler-populatecontextrecords-version.xml to a safe location outside of the tenant route deployment folder. We need to save a copy of the original file so that we can restore it later after we complete the steps to load the sample data. -
In the deployment folder, open the route-dxt-scheduler-populatecontextrecords-version.xml for editing.
-
Find the Run on configured time trigger section and modify the jobdatamap.arg_orphan_to parameter. If you want to see the same results as described in this tutorial, you must calculate contexts for all tutorial data which come from 09/2022 or 10/2022. For example, if you start tutorial data calculation in 01/2023, you must set jobdatamap.arg_orphan_to=TM-4. Save the file.
-
The calculation runs several times according to the set scheduler and maximum of results until it counts all the contexts; for our data, it takes about half an hour. If you need to speed it up, you can change the scheduler and increase the jobdatamap.arg_max_result parameter to a larger value to calculate contexts faster. For example, you could change it to jobdatamap.arg_max_result=1000.
-
When you have completed your modifications to the tenant context record calculation route XML file, move the modified file to a location outside of the tenant route deployment folder so that it disappears from the folder. (Make sure not to overwrite the original XML file you copied in the first step). This action unregisters the original version of the file with the server.
-
Now move your modified file back into the tenant route deployment folder. This action registers your modified file with the server so that the modifications are reflected in the job scheduling.
-
You should revert the scheduled context calculation job back to the original state after all contexts have been calculated. To check that calculation is finished, check the dirxaudit-server.log file in install_path/server_container/tenants/tenantID/logs.
When you find the message Created context for 0 audit messages. … PopulateContextRecordsJob has finished., you can be sure that all contexts have already been calculated.
Delete the modified route-dxt-scheduler-populatecontextrecords-version.xml route file in the tenant route deployment folder and then copy the original route backup file you copied and saved in the very first step back into the tenant route deployment folder. This action resets the original context calculation job settings. -
Now proceed with the next sample data loading steps.
After running the context calculation, you should see the correct contexts in the Audit analysis details view in several context-based reports and in the History details view.
Loading the Sample Data from the DirX Identity Source
DirX Audit comes with a pre-defined set of sample data from the DirX Identity source. This data was prepared by performing the DirX Identity Tutorial and it is stored in DirX Identity XML file format. To load this data into an empty (data) database, we need to:
-
Navigate to the folder install_media/Additions/Data/SampleData/Identity/Data on your DirX Audit installation media.
-
Copy all files named dxi_audit_number.xml and dxi_auditTrail_number.xml in this folder to the input folder you specified for DirX Audit file collector imports when you configured the collectors for your tenant; for example, C:/dxt/input/file/tenantID/dxi.
Be sure to copy the files into the correct folder configured for your tenant.
| In the file names above, number is a number assigned to the file when it was created during the DirX Identity. The suffix _audit distinguishes the audit messages from the JMS queue and _auditTrail the audit messages collected from LDAP. |
| The DirX Audit Server creates the input folder - for example, dxi - when it first starts up. If this folder does not currently exist in your installation, you can create it yourself in the input folder and then copy the files to it, or you can start the DirX Audit Server first and then copy the files. |
|
If you do not know the path to the input folder for DirX Audit file collector imports, you can find it by looking in the Tenant Configuration Wizard tabs. For this tutorial, the relevant component is: Server File Collector for DirX Identity Format Search for the parameter Input folder. If you insert only the folder name without the full path in the Tenant Configuration Wizard; the input folder is created in the install_path/server_container/tenants/tenantID/ folder. |
-
If you have not started DirX Audit Server service, start it now. This action triggers the file collectors to import the files in the input folder into the DirX Audit Database (we recommend importing all files). After a few minutes, the files you copied should disappear from the input folder (for example, C:/dxt/input/file/tenantID/dxi).
| If your DirX Audit installation has set up the DirX Audit components like the DirX Audit Server as system services, you can start and stop the DirX Audit Server as you would any other operating system service; for example, on Windows, from the Services panel. See the subsection on installing system services in Chapter 5 of the DirX Audit Installation Guide for more details. |
Loading the Sample Data from the DirX Access Source
DirX Audit also comes with a pre-defined set of sample data from the DirX Access source. To load this data into your database:
-
Navigate to the folder install_media/Additions/Data/SampleData/Access on your DirX Audit installation media.
-
Copy all files named dirx_access_number_sampledata.xml in this folder to the input folder you specified for DirX Access file collector imports when you configured the collectors for the tenant; for example, C:/dxt/input/file/tenantID/dxa. Be sure to copy the files into the correct folder configured for your tenant.
| The DirX Audit Server creates the input folder - for example, dxa - when it first starts up. If this folder does not currently exist in your installation, you can create it yourself in the input folder and then copy the files to it, or you can start the DirX Audit Server first and then copy the files. |
|
If you do not know the path to the input folder for DirX Audit file collector imports, you can find it by looking in the Tenant Configuration Wizard tabs. For this section, the relevant component is: Server File Collector for DirX Access Format Search for the parameter Input folder. If you insert only the folder name without the full path in the Tenant Configuration Wizard; the input folder is created in the install_path/server_container/tenants/tenantID/ folder. |
-
If you have not started DirX Audit Server service, start it now. This action triggers the file collectors to import the files in the input folder into the DirX Audit Database (we recommend importing all files). After a few seconds, the files you copied should disappear from the input folder (for example, C:/dxt/input/file/tenantID/dxa).
-
When all contexts have been calculated, copy the saved original route-tenantID-dxt-scheduler-populatecontextrecords-version.xml back into the deployment folder. This action registers the original settings with the server and restores the scheduled context record population to its original state. You can check to see if the calculation has finished by checking the dirxaudit-server.log file in install_path/server_container/tenants/tenantID/logs, where you can find logged messages indicating that no new contexts are calculated; for example,
| ContextRecordProducer | 64 - dxt-db-persistence - 7.1.12.SNAPSHOT | UpdateContexts result: 0 failed events, 0 new contexts.
Loading the Sample DirX Identity History Data
The history database is usually populated by scheduled history synchronization server jobs, synchronizing DirX Identity entries snapshots as history entries into the DirX Audit history database. To facilitate the DirX Audit tutorial environment setup without the need to configure a connection from DirX Identity and the history synchronization job, we provide a set of LDIF files that contain exported history entries.
We’ll use the DB maintenance tool (described in more detail in the Tools chapter of the User Interface Guide) and specify the target tenant with its history database to load these prepared history entries automatically into the specified DirX Audit database:
-
Navigate to the folder install_media/Additions/Data/SampleData/Identity/History on your DirX Audit installation media and then copy its contents to your hard drive to the folder install_path/tools/db_maintenance/bin.
-
Before running the batch file, which will import the history data you have to modify it by specifying the tenant ID - i. e. the already configured tenant which includes the target history database into which the history entries will be imported. Edit the install_path/tools/db_maintenance/bin/dxtTutorialLdif2Histdb.bat file and replace all occurrences of *tenantid* with the ID of your target tenant.
-
Now start the command line as administrator from the Start menu and run the batch tool install_path/tools/db_maintenance/bin/dxtTutorialLdif2Histdb.bat. This action automatically loads all the prepared history entries sets into the DirX Audit database specified in the connection file. There are several sets of history entries representing individual DirX Identity Tutorial exercises, so the loading procedure will run repeatedly in several cycles and can take up to 15 minutes to complete.
-
If you’re working with the Oracle database, you’ll be able to see the entry attributes after running DXT_HISTORY_VIEW_PROCEDURE. By default, it is set to run once a day during the night. To be able to see the changes immediately, contact your database administrator to run Procedures/DXT_HISTORY_VIEW_REFRESH manually. As some history views are based on foreign keys, this procedure should be run after calculating history data foreign keys as described in the next step.
Calculating History Data Foreign Keys
After we’ve loaded the sample DirX Identity history entries into the history database, we also need to calculate the foreign keys. This procedure connects related entries, which results in the display of related DNs in entry attributes as links in the Manager application. By default, the DirX Audit Server calculates the keys regularly every night. However, we want the calculation to occur right now, instead of having to wait until the next day. To trigger immediate calculation, we need to edit the server configuration file to enable the predefined 30-second trigger:
-
Navigate to the folder install_path/server_container/tenants/tenantID/deploy/routes/. Copy the tenant foreign keys calculation rout XML file route-dxt-scheduler-updatehistdb.xml to a safe location outside of the tenant route deployment folder. We need to save a copy of the original file so that we can restore it later after we complete the steps to load the sample data.
-
In the deployment folder, open the route-dxt-scheduler-updatehistdb.xml for editing.
-
Uncomment the Run immediately - only once trigger section and comment out the Run on configured time trigger section.
-
Modify 2 values - (TD-7) and (TD-30) to cover all tutorial data which come from 09/2022 or 10/2022. For example, if you start the tutorial history data foreign keys calculation in January 2023, you must set it to TD-150 which covers 150 days into the past. Save the file.
-
Next, copy the modified file to a safe location outside of the tenant route deployment folder. Delete the modified route XML file that exists in the tenant route deployment folder and then copy your saved modified version back into the folder. These steps ensure that the modified settings are reflected in the job scheduling.
-
Wait five minutes to make sure that all the foreign keys have been computed. You can optionally check this in the dirxaudit-server.log server log file in install_path/server_container/tenants/tenantID/logs where you can find logged messages indicating that the recalculation has already been performed and so no new foreign keys need to be added; for example, UpdateHistoryDbJob has finished.
The visible result of this action is that when you open any history entry details page, there will be active links to other related or assigned history entries; for example, user Alle Nicolas with links to his assigned accounts and privileges, his organizational unit and so on. -
Revert the changes to prevent constant running of the update job: delete the modified route-dxt-scheduler-updatehistdb.xml route file in the tenant route deployment folder and then copy the original route backup file you copied and saved in the very first step back into the tenant route deployment folder. This action resets the original foreign key calculation job settings.
Calculating the Sample KPIs
DirX Audit can show KPI values in a form of chart. The aggregated source data for charts is calculated from audit events and messages and also from history entries. DirX Audit Server calculates the values regularly. For immediate calculation of the aggregated data you can use the fact population command-line tool installed as a part of DirX Audit.
-
Navigate to the folder install_path/tools/db_fact_population/bin.
-
Start the fact population tool by running dxtPopulateFacts -tenantid tenantID; where tenantID specifies the identifier of a configured tenant. For example:
dxtPopulateFacts -tenantid 71a75691-d28a-48ce-a542-6d6af7ece680
The tool populates a set of OLAP structures that contains aggregated data for presenting KPI values. It uses database connectivity settings stored in the configuration file of the specified tenant. See the section “Using the DirX Audit Tools” in the DirX Audit User Interface Guide for more options. See the subsection on installing system services in Chapter 5 of the DirX Audit Installation Guide for more details. You can also check the result of this action in the Dashboard tab in the next step. The components will display the data loaded in previous steps and computed in this step.
Loading the Default Dashboard Components
DirX Audit comes with a set of default Dashboard components that you can load into the DirX Audit Manager and use right away. In this preparation step, we will load these components and then select a Dashboard layout.
Loading Dashboard Components
First, we need to log in as Tinker Boris, because only the Audit Administrator can manage and import public components. (Dalmar Christopher and Abele Marc are Auditors, so they can only use public components but cannot manage them. They can only import the components for their private use):
-
Start your Internet browser and specify the URL of DirX Audit Manager for your tenant, for example:
https://localhost:8443/AuditManager/login.xhtml?tenant=685a5aec-4c34-4e64-94fe-377df25f8774. -
In Name, enter Tinker Boris.
-
In Password, enter the password dirx, and then click Login.
Now we can import the default Dashboard components:
-
Click the Dashboard tab, if it’s not already selected.
-
Click Manage Components to open the Manage Components dialog.
-
Select the Public Components tab (if it’s not already selected) and then click Import.
-
In the display area of the Import dialog, click Add. A file selection dialog is displayed.
-
Navigate to the folder install_media/Additions/Data/Components.
-
Type Ctrl+A to select of the files in the folder install_media/Additions/Data/Components in one step and then click Open.
-
The Import dialog display area now shows the files in the file list. Click Upload to upload them to the application, and then click Import to load them into to the Dashboard. After a few seconds, the new components are displayed under the Public Components tab.
-
Click Close. Now we’ve completed the task of loading the default components into the Dashboard.
-
Click Logout to log out of DirX Audit Manager.
Selecting a Dashboard Layout
Now we need to select a Dashboard layout in which to display the new components and select the components to be displayed:
-
In Name, enter Tinker Boris to login again.
-
In Password, enter the password dirx, and then click Login.
-
Click the Dashboard tab if it’s not already selected.
-
Click Layout to open the Layout dialog.
-
Select the layout that presents components in two rows and three columns, if not already selected.
-
Click Add new, select the Public Components tab and move to the second table page to add the DirX Identity total audit events on accounts by month and operation component.
-
Click Add new again to add the Total audit events by month and source component, again from the Public components tab, this time from the third table page.
-
You can populate the layout with the other components, but you’ll select specific components in subsequent tutorial steps.
-
Click OK.
Working with the Tutorial
Once you have completed your preparation for the tutorial, you should back up the example database so that you can restore the prepared example database later on. It is also a good idea to back up your example database each time you successfully complete a quick start exercise. This way, you can retry an exercise that failed for some reason without having to return to the very first exercise.
Refer to your database product’s user documentation for instructions on how to back up your data.
Logging In
Log in as Tinker Boris:
-
Start your Internet browser and specify the URL of DirX Audit Manager for your tenant, for example:
https://localhost:8443/AuditManager/login.xhtml?tenant=685a5aec-4c34-4e64-94fe-377df25f8774
(See the chapter "Logging In" in the DirX Audit User Interface Guide for details.) -
In Name, enter Tinker Boris.
-
In Password, enter the password dirx, and then click Login.
After a few seconds, the DirX Audit Manager displays its main page. (See "About the Main Page Layout" in the DirX Audit User Interface Guide for details.)
| By default, DirX Audit Manager uses the language selected in the browser. Please select GB in the language selection area (if not selected) to see the same data results as described in this tutorial. |
Analyzing Aggregated Data with the Dashboard
This exercise demonstrates the Dashboard feature of DirX Audit. We’ll explore how to
-
Use default Dashboard components
-
Modify Dashboard components
-
Create your own Dashboard components
Using Default Components
DirX Audit comes with a set of default components that you can use right away. We loaded these components into the Dashboard in the preparation step "Loading the Default Dashboard Components". In this exercise, we’ll use some of these components.
Using the Total Audit Events by Month and Source Component
The sample database contains a set of audit events collected from DirX Access and DirX Identity.
In the Dashboard view, look at the tile that displays the Total audit events by month and source component. First, we need to adjust the time filter to display all the sample data:
-
Click
 to open the Edit component dialog.
 -
Click the Data tab if it’s not already selected.
-
In When, select Any time.
-
Click Save.
Now the chart shows a list of months. There is a stacked bar for each of them. Pieces of the bar represent audit sources like DirX Access and DirX Identity and the total number of these operations over objects. For example, DirX Identity produced 220 audit events in September 2022 and 1012 audit events in October 2022.
-
Click
 to maximize the component. The component now takes over the entire Dashboard view display.
 -
Click on the area next to the 1012 (DirX Identity, Oct/2022) label. This action initiates a drill-down to audit events that originated in DirX Identity in October 2022. A list of audit events appears.
-
Set the Items per page to 20.
-
Click
 to return to the Total audit events by month and source component.
-
Notice the buttons with component names that appear below the maximized Total audit events by month and source component. These buttons link you to the other components that you have selected for display in the Dashboard view. To switch to one of these components, you can simply click its button.
-
Click
 to restore the component’s size from maximized to original.
Using the DirX Identity Total Audit Events on Accounts by Month and Operation Component
Now analyze operations over accounts:
-
Look at the component displayed in the Dashboard view. Again, we need to change the time settings:
-
Click
to open the Edit component dialog. -
Click the Data tab if it’s not already selected.
-
In When, select Any time.
-
Click Save.
-
-
The chart shows a list of months. There is a stacked bar for each of them. Pieces of the bar represent the following operations: Add Object, Delete Object, Disable, Enable, Update Object and the total number of these operations over account objects. For example, the Add Object operation was run 63 times in October 2022.
-
Click on the area at the 63 (Add Object, Oct/2022) label to drill down to audit events that record the addition of new accounts. You can use the page navigator to browse the list of events. You can also change a number of audit events per page in the Items per page list.
-
You can see that some of the accounts were created manually (manual) and some on event or on request.
-
Click
to return to the DirX Identity total audit events on accounts by month and operation component in the Dashboard view.
We can also use the zooming feature to view only those records within the selected time period in a more detailed time resolution:
-
Click the Oct/2022 month indicator next to the bar with the October stacked bar. You can now see only the October events bars but divided by their day time stamp. This view can be useful when you are interested in getting more detailed information on a particular time range and it allows you to quickly zoom in on it without having to change the entire component time constraint through the settings.
-
Click
 to reset the zoom level.
Changing Component Settings
We may also want to change a component’s settings: its data source and the style in which the data is displayed. The next exercises demonstrate how to accomplish these tasks.
Changing Component Data
First, change the time constraint of the source data:
-
Choose a component you want to change; for example, the DirX Identity total audit events on accounts by month and operation component.
-
Click
to open the Edit component dialog. -
Click the Data tab if it’s not already selected.
-
In When, select Custom time.
-
Set 1/9/2022 to From and 30/9/2022 to To.
-
Click Save. The chart is recalculated and the chart’s subtitle indicates the time frame you just applied. You cannot see October 2022 data in this component now because it is out of the changed time scope. To adjust this:
-
Click
to open the Edit component dialog again. -
Set the Custom time values to 1/9/2022 in From and 31/10/2022 in To.
-
Click Save. Now all data is visible again.
In the Data tab, you can also change a component’s fact table, fact and dimension sources. If you do this, don’t forget to change the component’s title to correspond with your new selection.
Changing the Component Style
Now modify the component’s style:
-
Choose a component you want to modify; for example, the DirX Identity total audit events on accounts by month and operation component.
-
Click
to open the Edit component dialog. -
Select the Style tab (if it’s not already selected).
-
Click the drop-down arrow in Color scheme and then select another color option.
-
Click Save. The chart is recalculated and a different color scheme is applied.
You can also change other style settings. Some of them are applicable only for selected component types.
Creating a New Component
In this exercise, you’ll select an existing Dashboard component and then change it:
-
In the DirX Identity total audit events on accounts by month and operation component, click
to open the Edit component dialog. -
Click Save As …. In Component title, enter Successful password changes by month.
In Component Name, enter evn__dxi_pwdchanges__succeeded__datemonth .
In Add to dashboard, select as new and then click Save. -
If the new component is not displayed in the dashboard, open Layout and move your new component up in the list so that it is visible in the Dashboard.
-
Click
to open the Edit component dialog again. -
Click the Data tab if it’s not already selected.
-
In When, select Any time.
-
In Fact table, select Password changes. In Facts, select, Succeeded. In Dimensions, select Month.
-
Change the Chart class selection icon to
 (one fact and one dimension).
 -
Click the Style tab and change the component’s style to whatever you’d like to use.
-
Click Save.
The new component shows only successful password changes on accounts and users aggregated by month. You can drill down to list corresponding audit events.
You can also export the component into an XML file and later import it back into the Dashboard.
Analyzing Audit Events with the Audit analysis
This exercise demonstrates how to use the DirX Audit Manager Audit analysis page. The Audit analysis provides a view on audit events in a user-friendly form. It extends the audit message data with three additional columns: Operation, Type and Detail. Information is digested from fields of the related audit message when the message is persisted into the DirX Audit Database. Each audit message can have no related audit events, exactly one related audit event, or more than one related audit event.
In this section, we’ll demonstrate how to:
-
Search for and analyze events
-
Work with event search filters
-
Use an advanced search
-
Create an audit events report
Searching and Analyzing Events
We’ll begin this exercise by opening the Audit analysis:
-
If you are not logged in to DirX Audit Manager, follow the instructions in "Logging In".
-
In the DirX Audit Manager main page, click the Audit analysis tab.
-
Click Search.
The result is a table with 10 rows that represent audit events. The additional rows at the top and bottom of the table define column names.
Searching for an Operation
Now we’ll look at all events of a specific operation; in this case, the Add Assignment operation:
-
In Source, select DirX Identity.
-
In Operation, type Add Assignment.
-
Click Search.
Test this query with other operations; for example, Accept and Reject.
Analyzing the Audit Event Details
Now you can explore the details of the audit message using the Add Assignment operation:
-
In a result table, select a message with Operation = Add Assignment.
-
Click the Show Details icon
 .
.
The pop-up window with the event details opens. You can see Audit Event, Identification, What, Who, Where From and Original Message sections.
Analyzing the Related Events
You can also explore the related events using the Add Assignment operation:
-
In a result table, select a message with Operation = Add Assignment.
-
Click the Show Related Events icon
 .
.
The display with the table containing audit events opens. The message for which this function is calculated is highlighted in gray. The other messages are related to the original one, which means they caused or they were caused by the original action.
Working with Search Filters
This exercise demonstrates how to work with event search filters: we’ll use the filter definition area in Audit analysis to create a private filter, modify it and then delete it.
Creating a Private Search Filter
You can save your search criteria as a filter so that you can easily repeat common queries; here, you’ll create one for the User to Role Assignment event:
-
In Source, select DirX Identity.
-
In Operation, type Add Assignment.
-
In What Type, type User to Role.
-
Click Search to check what your selected filtering options will display.
-
Click Save As….
-
The Save as … Filter pop-up window opens. In Name, type User to Role Assignment.
-
In Description, type User to role assignment from DirX Identity audit events.
-
Click Save.
You have just created a private filter definition that searches for User to Role Assignment events from DirX Identity. Private filters are available only to the user who created them. When you select it from Select Filter, the search fields are pre-filled with your saved search criteria and the search action is performed automatically.
Modifying a Search Filter
You can change the search criteria of your saved filter:
-
In Select Filter, select User to Role Assignment.
-
In Who, type DomainAdmin.
-
Click Save.
Your filter definition is now changed. You can also modify the filter’s name and description:
-
Select Manage Filter
 .
. -
Click Edit
for User to Role Assignment. -
In Name, type User to role assignment by DomainAdmin.
-
In Description, type User to role assignment from DirX Identity audit events caused by Domain Admin.
-
Click Save.
The filter’s name, description and search criteria are changed.
Deleting a Search Filter
You can delete a filter in the following way:
-
Select Manage Filter
. -
Click Delete
 for User to Role Assignment by DomainAdmin.
 -
The message Delete this filter? is displayed. Click OK. The filter is deleted and removed from the list. It is also removed from the available filters in Select Filter.
-
Click Close to close the pop-up window.
If you have Audit Administrator rights, you can use the procedures shown here to create, modify and delete public filters visible to other users. A private filter can be used, modified and deleted only by its owner. Public filters created by the Audit Administrator can be used but not deleted by an Auditor. The Audit Administrator is permitted to delete his private filters and public filters.
Using an Advanced Search
Sometimes the search criteria provided in the filter definition area are not enough. If this is the case, you can use the Advanced Search section, which provides more options for querying audit events. In this exercise, you will search for self-assisted password settings:
-
Delete your previous search criteria from Operation and What Type fields. The fields should be empty. You can also clear the fields by selecting the default Empty filter from the filter selection above the search criteria fields.
-
Click the Advanced Search icon
 .
. -
In Property, select Password self assisted.
-
In Value, select Assisted. See the section "Dimensions" in the chapter "Dashboard Data" in the DirX Audit Administration Guide for details.
-
Click Search.
You can see the list of events generated by assisted password settings in the connected systems and in DirX Identity Web Center. The changes were provided by domainAdmin (the Who search criterion).
The settings in the Advanced Search section are also saved to the private search filter.
Creating an Audit Events Report
When you perform a search, you can use the Report function to export audit events to a file and/or send it via email:
-
Use the values returned from previous exercises or provide a search according your criteria.
-
Click Report. A pop-up window opens.
-
In Template, select EventMonitorAll.
-
In Format, select PDF.
-
In Encoding, select UTF-8.
-
In Rows, type 0 to export all records.
-
Click Export.
A new tab opens that displays the list of audit events that correspond to the search criteria.
Analyzing History Data with the History View
The History view works directly with history entries stored in the DirX Audit Database. As part of preparing to run this tutorial, you loaded sample DirX Identity history data generated from running the DirX Identity tutorials into your DirX Audit History database. In this set of exercises, you’ll learn how to use DirX Audit Manager’s History view to explore this sample data. For details on the DirX Identity tutorials on which these exercises are based, see the DirX Identity Tutorial.
In this exercise, you’ll learn how to:
-
Generate a table of history entries
-
Create a report of history entries
-
Search for user history entries by name and by distinguished name
-
Explore the details of a history entry
If you haven’t used the History view before, we recommend reviewing the information about its basic functions presented in the chapter "Using the History View" in the DirX Audit User Interface Guide before continuing with this exercise.
Generating a Table of History Entries
To get started, you’ll use the DirX Audit Manager’s History view to generate a table of history entries for DirX Identity events:
-
If you aren’t logged in to DirX Audit Manager, follow the instructions in "Logging In".
-
In the DirX Audit Manager’s main page, click the History tab.
-
Leave the default values in When (Any time), Type (User), and Attribute (uid) and then click Search.
DirX Audit Manager displays a result table below the search area that lists all of the matching entries. Each row represents one history entry that matches the search criteria. In our example, the result table shows ten users and a total of 109 users found.
Creating a History Report
Sometimes you may want to save your history entry result tables outside of DirX Audit Manager. To accomplish this task, you use the Report feature in DirX Audit Manager’s History view to save the result table to a formatted file. To save the result table you just generated:
-
In the History main page, click Report. A pop-up dialog appears with parameters for setting the output format.
-
Leave the default values as they are, and then click Export. Note that the default report exports only the first 100 entries while the sample data contains 109 user entries. If you want to export all 109 entries, increase the Rows value or set it to 0 (which means exporting all entries without any limitation).
-
In the Internet browser dialog, you can select to open the report, save it, or cancel it. Click Open to see the results.
The reporting feature demonstrated here is a simple way to export on demand the search result lists generated from your current search criteria. You can read more about this feature in the section "Exporting History Entries" in the chapter "Using the History View" in the DirX Audit User Interface Guide.
DirX Audit Manager’s Reports view provides a more powerful, complex mechanism for generating auditing reports both on demand and according to a schedule. We’ll demonstrate how to use this feature later on in this tutorial.
Searching for a User’s History
There are several ways to search for a history entry. You can use a specific attribute and its value for searching or you can click on the Advanced Search icon and search for a history entry by its name, DN or dxrUid. We’ll show you how to use two of these methods in this exercise.
Searching for a User Entry by Name
First, we’ll search for a user history entry by its name. In this case, we’ll search for a history entry for the user Taspatch Nik:
-
In Type, select User.
-
Click the Advanced Search icon
. -
In Name, type Taspatch and then click Search.
Because there is only one history entry in the sample database with the name Taspatch, DirX Audit Manager displays the details page for this entry. We’ll explore the details page in more detail in a later exercise. For now, click Switch to search form to return to the History view main page.
Searching for a User Entry by DN
Now we’ll search for Taspatch Nik using his distinguished name (DN):
-
In Type, select Any.
-
Clear Name in Advanced Search.
-
In dn, type cn=Taspatch Nik,ou=Global IT,o=My-Company,cn=Users,cn=My-Company.
-
Click Search.
Because DirX Audit Manager finds only one entry with this DN, it displays the details page for this entry. In the next exercise, we’ll explore this details page.
Exploring History Entry Details
In "Searching for a User’s History", you searched for and retrieved a unique history entry for Nik Taspatch. Because it’s the only history entry for this user, DirX Audit Manager automatically displays its details page with the Attributes tab table open by default.
The timeline area shows two comparison time point markers. The first time point is the creation time and date for the user entry Taspatch Nik. The second time point is the current date and time.
In the timeline area, you’ll see the following data for Taspatch Nik:
-
The time at which his user entry was created.
-
The number of attributes created for his user entry (55).
-
The number of roles (13) and permissions (18) assigned to him.
-
The number of groups to which he belongs (25).
-
The number of accounts he has (3).
In the data area, the Attributes tab table shows the list of attributes and their values depending on the selected comparison time point. In our example, the two time points are automatically selected and you can see the attributes and their values at each time point. Attributes that have changed are highlighted in yellow.
The data area also shows tabs for Roles, Permissions, Groups, Accounts, Risks, Events and Assignment cause. In the Show events for row above the timeline, uncheck the Permissions checkbox. The information in the timeline area about Nik Taspatch’s assigned permissions is no longer displayed.
Click Show changes only. Now you only see the changed values in the Attributes tab table and in the respective Roles, Groups, Accounts and Events tabs for Nik Taspatch. Now clear Show changes only and check the Permissions tab in Show events for because you’ll explore the history of one of Nik Taspatch’s assigned roles in the next step.
Exploring a Role’s History
Now you’ll explore the history of one of the roles assigned to Nik Taspatch: the Internal Employees role.
-
In the data area, click the Roles tab. DirX Audit Manager displays a table with the names of the roles assigned to Nik Taspatch, the date of their validity and their assignment mode. In the table, you can see that:
-
The role Internal Employee has been assigned based on a rule.
-
The role DXR User Administrator has been assigned by inheritance from a business object.
-
The other roles have been assigned manually.
-
-
In the Role Name column, click the link Internal Employee [rule]. This action directs you to this role’s details page with the Attributes tab table open by default.
-
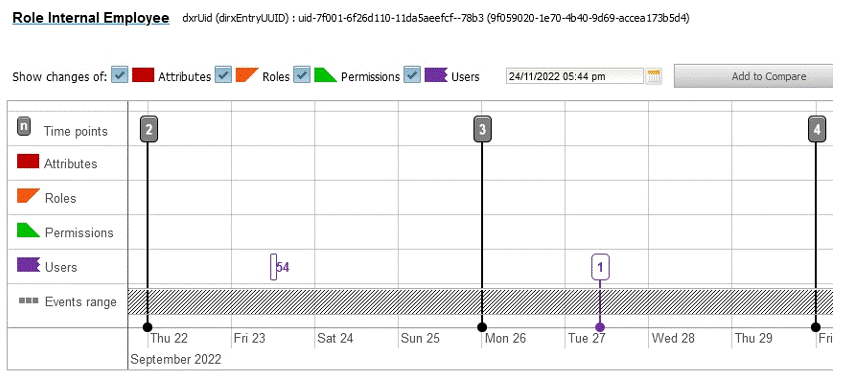
Examine the timeline area for the Internal Employee role to view the event markers indicating the users that have been assigned to the role within the two comparison time points.
-
Click the Users tab in the data area. DirX Audit Manager displays a table that lists the names of these assigned users. Note that the table shows 70 records about user assignment changes, the timeline shows cumulative information due to the zoom level. To view the times in milliseconds of each user-role assignment, you’ll need to adjust the timeline’s scale and then zoom in to the millisecond level of the original time.
-
Use the zoom-in button in the details page header to expand the timeline’s scale until you can see the event markers that indicate the precise time of each role assignment. Now click the Autozoom button
 to return to the timeline’s original scale. (Note: on mouse devices that provide wheels, you can use the mouse wheel to zoom in the timeline. You can also use the wheel to scroll down to view the data area in the history detail page, but be careful that your mouse cursor is not in the timeline, or you’ll zoom in the timeline instead of moving to the data area.)
Next, you’ll explore the user changes step by step:
-
Add three comparison time points to the timeline (by double-clicking in the time line near one of the User event markers or using the Add to Compare function) and then zoom into the timeline until you show the following scenario:

-
Scroll down in the details page to view the table with the user names. You can see that some users do not have any time records in the first few columns because they were assigned to the role later.
-
The timeline in the table shows the cumulative information about 55 user assignment changes in the time period of 23/09/2022 - 27/09/2022 because the zoom level is set to months. To view the times in more detail, you’ll need to adjust the timeline’s scale and zoom in to days. Now you can see one event 27/09/2022 and the cumulative information about 54 user assignment changes 23/09/2022. You can proceed this way up to milliseconds.
-
Check Show changes only. Now you can see the following information:
-
The names of the users who were assigned to the role in the process of following the exercises in the DirX Identity tutorial.
-
-
Click the Attributes tab and then uncheck Show changes only.
-
Now examine the value of the dxrRoleAdmin attribute. You’ll see that Taspatch Nik is listed as a value. This means that Nik Taspatch was assigned to the role when it was created and that he is the role’s administrator.
Exploring a User’s Account History
Next we’ll examine Nik Taspatch’s account assignments. To return to Nik’s details page from the Internet Employee role details page, you can either:
-
Click the Taspatch Nik value for dxrRoleAdmin in the Attributes tab table (the highlighted and underlined text).
-
Click the down-arrow in Already viewed entries in the details page header and then select the history entry for Nik Taspatch that you previously viewed.
DirX Audit Manager returns you to the details page with the Attributes tab table open by default.
Click the Accounts tab. The table shows the names of the accounts created for Nik Taspatch and the corresponding target system name.
Click the expansion arrow next to the account name Nik Taspatch 5326 (valid for Extranet Portal target system). You can see values for account state, target system state and login name.
Exploring Related Events for a User
Now you’ll look at the events related to Nik Taspatch’s history entry:
-
Click the Events tab.
-
Check the From and To fields and the Events range bar in the timeline. The default scope of the Events range bar is three months previous to the current day. The From and To fields display these dates.
-
To view the events in September and October, you need to extend the default scope. Click the Events range bar in the timeline and then move the start of the range to September 2022 and end of the range to October 2022.
-
Examine the Search in field. If it’s not already selected, select the What value from the list. Notice that there are no events for What that contain Taspatch Nik because there were no changes to any of the audited attributes for the user Nik Taspatch processed in the sample data from the DirX Identity tutorial run.
-
Go back to the Search in field and then select the Who value from the list. Now 41 events are shown because Taspatch Nik was the requester and/or the workflow approver of changes for other users during the DirX Identity tutorial run. You can learn about the details of these changes by reviewing the DirX Identity Tutorial exercises.
You’ve completed the initial exercises for learning how to use the History view. You’ll find more exercises on browsing audit history in the chapter "Identity Auditing".
Setting up Reports with the Reports View
DirX Audit Manager’s Reports view allows you to create various reports on events and history and then send them to selected recipients as email attachments. In this section, we’ll demonstrate these tasks.
To get started with this exercise:
-
If you are not logged in already, follow the instructions in the "Logging In" section to log in to DirX Audit Manager.
-
In the DirX Audit Manager main page, click the Reports tab.
Next, you’ll learn how to:
-
Work with report sets and report files
-
Schedule reports for email delivery to recipients
Working with Report Sets
When you want to create and send a report, you need to create a report set first. A report set contains one or more report files, which are represented by separate email attachments in the generated email message. These files in turn contain one or more reports selected from the list of available reports. Note that you must restrict yourself to using PDF for your reports if you want to create a report file with multiple reports. Other formats don’t support this feature.
In this exercise, you’ll learn how to:
-
Create a report set
-
Add a report file to a report set
-
Add a report to a report file
You can read more about how to work with report sets, report files and reports in the chapter "Using the Reports View" in the DirX Audit User Interface Guide.
Creating a Report Set
First, you’ll create a new report set named Demo report:
-
Click
 to create a new report set.
 -
In Name, type Demo report. In Description, type Demo report set with two files. Using these fields makes it easier to identify report sets when they are displayed in the report set definitions table in the Reports view.
-
Click Save.
The report set you just created is now listed in the report set definitions table on the Reports main page.
Adding a Single Report File to a Report Set
Now you’ll add a report file that contains one report to the report set you just created:
-
Click
in Demo report in the list. This action opens the Edit report set dialog with the File tab open by default. -
Click
to add a new report file. This action starts the report file creation wizard, which displays a list of available report file templates. There are two types: report files that contain only one report (identified by the  and the
  icons in the list) and report files that contain multiple reports (identified by the
  icon in the list).
 -
You can use Name or Tags to filter the list of report file templates. Type Event in Tags. Now only the reports with the Event tag are displayed.
-
Click on Changes on User to Privilege Assignments by User to select it in the list. The wizard opens the Report scope dialog, which allows you to define your report file’s parameters.
-
In the When section, select Any time.
-
In the Users section, specify the users whose data you want to view. In Identifying Attributes, select Name and then click Search. In the list of users in the Found table, check the boxes next to Bader Hans and Baretti Franca, and then click Add. These users are now shown in the Selected table.
-
In Attribute Value, type Teacher Mark and then click Search. Now check the box next to Teacher Mark (ou: Professional Services, o: My-Company, alt: 83730) and then click Add. Teacher Mark is now shown in the Selected table.
-
You can click Preview to check the results of your filtering criteria. A dialog window opens, offering to open the preview PDF directly with the browser or to save it for later checking. Note that the Row limit field restricts the amount of results displayed in the Preview report. In this example, clicking Preview helps you to determine that there are no access requests events for Baretti Franca in the sample data set.
-
Click Finish to complete the report file definition.
-
Now type Changes on User to Privilege Assignments by User - Bader Hans, Baretti Franca and Teacher Mark in Name. This file name will be displayed in the email as the name of the attachment and will also be displayed in the report set File tab.
-
Next, type User to Privilege Assignments by 3 users, pdf file format in Description.
-
Click OK. The report file is inserted into the report set and is displayed in the file list.
-
Click Save to save your changes to the Demo report report set.
Adding a Multi-Report File to a Report Set
In this exercise, you’ll add another report file to your report set. This report file contains two reports, which will be collated into one email attachment later on.
-
Click
in Demo report in the list. This action opens the Edit report set dialog with the File tab open by default. -
Click
to add a new report file. -
Use Name to filter the list of report file templates: type Logins in Name. Now only the reports that contain Logins in their names are displayed.
-
Click on the Total Sum of Logins report in the list to select it.
-
In When, select Custom time From 01/09/2022 To 31/10/2022.
-
In the Source section, define the source for the data you want to see. In Identifying Attributes, select Name and then click Search. In the Found table, check the box next to DirX Identity and then click Add. DirX Identity is added to the Selected table.
-
Click Next report. This action allows you to insert another report into the file.
-
Clear Tags. In Name, replace Logins with Assignments. You now see only those reports whose names contain assignments.
-
Click State of Assignments by User to select it in the list.
-
In the When section, select End of Previous Month.
-
In the Users section, define the source for the data you want to see. In Identifying Attributes, select cn and then click Search. The Found table displays a long list of users.
-
In Attribute Value, type Abele and then select Abele Marc from the list. Now click Search. You can see Abele Marc in the Found table. Check the box next to the entry and then click Add. This user is added to the Selected table.
-
In Attribute Value, type Teacher Mark and then follow the same procedure as with Abele Marc to add Teacher Mark to the Selected table. Now search for Berner Hans and Taspatch Nik and then add them to the Selected table.
-
Click Finish to create the report file with two reports.
-
In Name, type File combines two reports in one attachment.
-
In Description, type Logins for DirX Identity, Assignments by user for Abele Marc, Teacher Mark, Berner Hans and Taspatch Nik.
-
Click OK. The report file is inserted into the report set and is displayed in the file list. You can see two different reports under the file you just added, which means that these two reports will be collated in one email attachment.
-
Click Save.
Sending a Report Set
Next, we’ll demonstrate how to schedule and send a report set. You’ll learn how to:
-
Schedule a report set for immediate delivery
-
Activate a report set so that it runs
-
Schedule a report set for generation and delivery
Scheduling the Report Set for Immediate Delivery
We want to send the reports in our report set right away so that we can review them, so we’ll set up a schedule for sending the report set immediately:
-
Click
in the Demo report set row to open it for editing. -
Click the Schedule tab and then select As soon as possible.
-
Check No end time. (When this box is not checked, you can define an end date after which the report is no longer sent.)
-
Click the Send to tab and then enter your email address in To.
-
In Subject, type Demo report set.
-
Type the message text in Body. For example, Report set generated from DirX Audit. The attachment contains two files. In the file Changes on User to Privilege Assignments by User - Bader Hans, Baretti Franca and Teacher Mark there is a report Changes on User to Privilege Assignments by User. In the file named File combines two reports in one attachment there are Logins and Assignments by user.
You can also leave the Body empty. The report status and description are then automatically added to the email message. -
Click Save.
Activating the Report Set
Even when a report set is planned to be sent and email fields are populated, the report set will not be processed if it’s in the inactive state. In this exercise, you’ll switch your Demo report set to the active status to send it right away:
-
An inactive report is identified by the
 icon in the first column of report set list. Click the inactive icon for the Demo report set to activate it.
 -
The icon changes to
 to indicate that synchronization is operating. After the DirX Audit Server processes the changes, the icon changes to
  to mark the report set as active.
 -
If you set up the SMTP email server correctly during DirX Audit configuration, you will receive the email with the report attachment. For the As soon as possible scheduling option, the report is sent only once after each editing and saving.
Scheduling the Report Set for Regular Delivery
As an auditor, you probably want to generate and send your reports on a regular basis; for example, at the end of each month.
To be able to see variable data, choose a dynamic time definition in the When report scope for the reports in a report set, and then set the report schedule to run regularly. This section shows how to make these changes for the Demo report set we created earlier in this exercise. First, you’ll edit the report set and change the scope for the reports it contains:
-
Click
in the Demo report row to open the report set for editing. You’ll see two report files. One of them is the multi-report file named File combines two reports in one attachment with two reports listed underneath it. Click next to Total Sum of Logins to open it for editing. In the report scope dialog, change When to Previous Month.
Click OK. -
Perform the same steps for the other report file Changes on User to Privilege Assignments by User - Bader Hans, Baretti Franca and Teacher Mark to change the When scope to Previous Month for the report it contains.
Next, edit the report set and schedule it to run on a regular basis:
-
Click the Schedule tab and then select Recurring.
-
In Start date, select today’s date. Set Time to run for five minutes from now.
-
Uncheck No end time and then set End date for one month from today. The email and report will not be generated after this date.
-
Set Frequency to Monthly.
-
Select today’s date in Day of month so that you’ll see the generated email immediately.
-
Click Save.
After the DirX Audit Server synchronizes these changes, you can see that your report has the active status and that the Next start date column contains a date and time.
We’ve now finished the introductory exercises for how to view and manage reports with DirX Audit Manager. The exercises in "Identity Auditing" demonstrate more report features and describe individual report content.