Using History
The History view is DirX Audit Manager’s interface to the DirX Audit History Database. Unlike the Audit Analysis view, which focuses on audit events, the History view works directly with history entries stored in the database.
This chapter describes how to:
-
Navigate the History page.
-
Filter history entries.
-
Manage history entries filter views.
-
View the history entries search results.
-
View history entry details.
-
Export history entries.
Navigating the History Page
The History page allows users to select and analyze history entries from the DirX Audit History Database for historical review and compliance tracking. The layout of the History page is shown in the following figure:
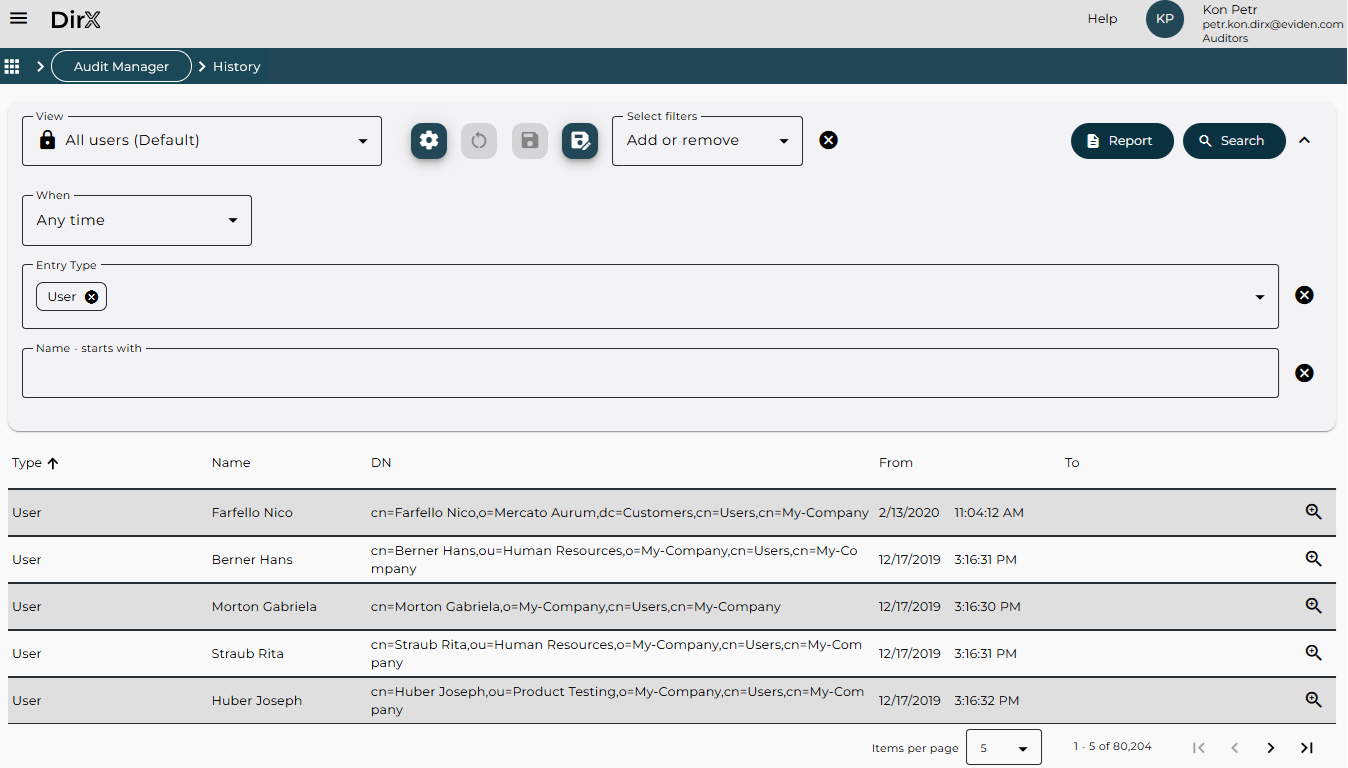
As shown in the figure, the History page consists of two main components:
-
Filter definition area allows you to define search criteria for retrieving specific history entries from the DirX Audit History Database. For detailed instructions on using this area, refer to the section “Filtering History Entries”.
-
Search results display area – presents the history entries returned by your search operation in a table format. A page navigator below the table enables users to browse through multiple pages of results. For details, see the section “Viewing the History Entries Search Results”.
Filtering History Entries
The Filter Definition Area allows you to define search conditions for retrieving history entries from the DirX Audit History Database. You can filter entries based on various attributes. To exclude an attribute from the filter, simply leave its field empty.
Start by selecting a view, which provides a predefined set of filters.
The default view is All users (Default), where:
-
When is set to Any time.
-
Entry Type is set to User.
For details, see “Managing History Entries Filter Views”.
The default view includes the following filters:
-
When – filters history entries by time period:
-
Relative: Previous Year, Previous Month, Month to date and so on.
-
Absolute: Custom Time to define a specific range using the From and To fields. Timestamps are rounded to the nearest second. For example, to find a history entry existing at 4/4/2025 2:24:18.408 PM, set To to at least 4/4/2025 2:24:19 PM.
-
Any time: No time filter applied. The fields From and To are not visible in this case.
-
-
Entry Type – filters by entry type, for example, User, Role, Account, Target System.
-
Multi-value: select multiple entry types.
-
To remove all values, click the Remove all
 icon.
Then search result displays all of the types.
icon.
Then search result displays all of the types.
-
-
Identifying attribute Name – filters by name prefix. You can enter one or more values. Remove values individually or clear the entire field.
Use the Select filters dropdown to add more filter fields:
-
Identifying Attribute – includes Name, DN, dirxEntryUUID, and dxrUID. Name is selected by default. Each selected attribute adds a field for entering one or more values or prefixes.
-
Small Attribute – filters based on specific attribute values.
-
Select an attribute name from the Select filters list.
-
Each selected attribute name adds a corresponding input field for entering values. These fields support multiple values, allowing you to specify more than one attribute value per attribute name.
-
For better readability, you can collapse the filter definition area by clicking the Collapse ![]() icon in the upper-right corner.
icon in the upper-right corner.
Remove individual attributes using the Remove attribute ![]() icon.
Remove all filters using the Remove all
icon.
Remove all filters using the Remove all ![]() icon next to the Select filters dropdown.
icon next to the Select filters dropdown.
Click Search button to execute the query. The results will appear in the search results display area.
-
Identifying Attributes: Results match entries with any of the specified values.
-
Small Attributes: Results match entries that satisfy all specified attributes.
-
DN uses an “Ends with” operator. Example: cn=MVS,cn=TargetSystems,cn=My-Company matches entries from the MVS node of target systems in the My-Company node.
-
Name, dxrUID, and dirxEntryUUID use a “Starts with” operator. Example: Entering Meeting in Name returns all entries starting with Meeting.
-
If no entries match the criteria, the message “No history entry found” is displayed.
Click Report button to export the search results. For details, see “Exporting History Entries”.
Managing History Entries Filter Views
You can name and save your custom filter views to the configuration database for future use. This allows you to quickly reapply commonly used filters without redefining them each time. Simply select a stored view from the View list and click Search.
This streamlines the search process and ensures consistency across repeated queries. History views are organized similarly to other views in DirX Audit Manager. For more details on using and modifying the views, see “Managing and Understanding Views”.
You can also clone, edit, and delete existing views. These capabilities help tailor the filtering experience to individual or organizational needs.
Viewing the History Entries Search Results
After executing a search, the results are displayed based on the number of matching entries. If the search returns more than one history entry, the search results display area presents history entries in a table format.
Each search result includes the following features:
-
Columns – Each column corresponds to an attribute of the audit event.
-
Rows – Each row represents a single history entry retrieved from the DirX Audit History Database.
-
Page Navigator – Located at the bottom of the results area. It allows you to navigate through multiple pages of results. For details, see “Using the Page Navigator”.
If the search returns exactly one history entry, the system bypasses the table view and directly displays the details page for that entry. For details, see “Viewing History Entry Details”.
If no entries match the search criteria, the system displays the message: “No history entry found”.
The following figure illustrates a typical result table page:
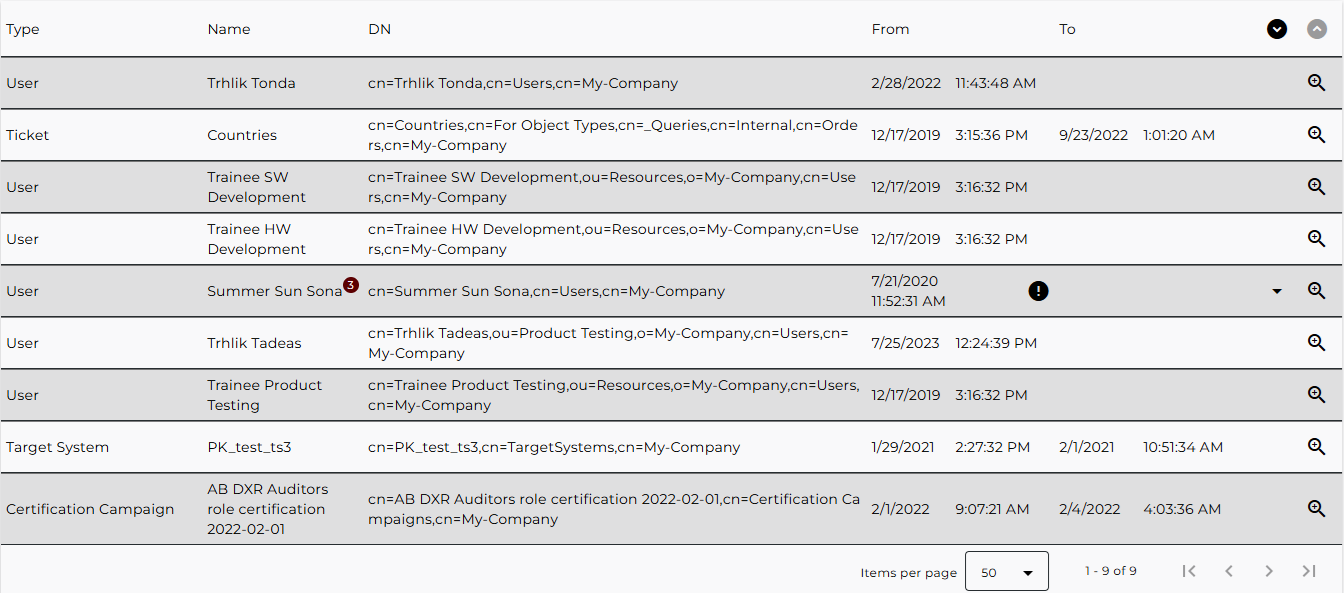
Each row in the search results table represents a history entry and includes key identifying information and interactive features:
-
Name and DN – identify the entry and reflect its location in the corresponding DirX Identity domain.
-
Hovering over the DN field reveals a tooltip displaying dxrUid and dirxEntryUUID. These values can be copied for further use.
If an entry’s Name or DN was modified during the selected time period:
-
The entry appears as multiple rows, each showing the state before and after the change.
-
For better readability, these rows are collapsed into a single line.
-
The collapsed row is marked with:
-
an exclamation mark
 icon,
icon, -
a count of the related records next to the name.
-
-
To expand a single modified entry, click the Expand all states
 icon at the end of the row.
 -
To expand all collapsed entries, click the Expand all rows
 icon at the top of the table.
 -
From and To columns indicate the entry’s lifetime:
-
From: When the entry was created.
-
To: When it was deleted or renamed.
-
To view detailed information about a specific entry, click the Show Details ![]() icon in the entry’s row.
This opens the details page for that history entry.
icon in the entry’s row.
This opens the details page for that history entry.
Viewing History Entry Details
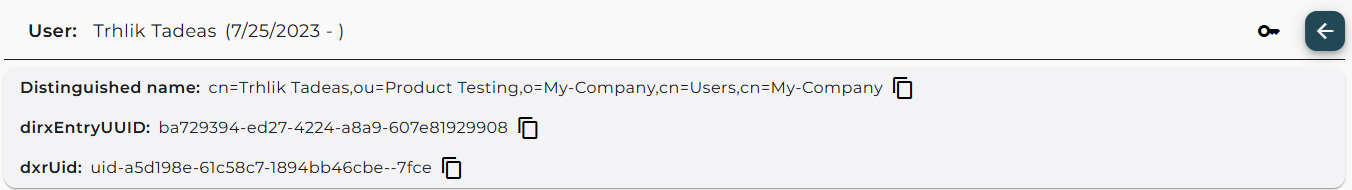
The history details page provides comprehensive information about a selected history entry.
It is divided into two main areas: a header area and a data area.
The header area displays the entry’s: type, name, identification attributes (Distinguished name, dirxEntryUUID, and dxrUid).
For better readability, the header area is collapsed by default.
To view identification attributes, click the Show identifiers ![]() icon in the upper right corner.
To hide them again, click the Hide identifiers
icon in the upper right corner.
To hide them again, click the Hide identifiers ![]() icon.
You can copy identification attributes for further use by clicking the Copy
icon.
You can copy identification attributes for further use by clicking the Copy ![]() icon next to each attribute.
icon next to each attribute.
The following figure shows an example of a history entry’s details page header area.
The following figure shows an example of a history entry’s details page data area:
To return to the History display area, you can:
-
click the Back
 button in the upper right corner, or
 -
use the navigation bar to jump to a different section.
The data area is organized into tabs, which vary depending on the entry type. Each tab contains a results table showing the entry’s data at selected comparison time points.
-
Attributes and Events tabs are common tabs available for all entry types.
-
Overview tab is available only for the Workflow Instance, Certification Campaign and Certification Assignment Change entry types.
-
Privileges tab is available only for the Certification Campaign entry type.
-
Roles and Permissions tabs are available only for the User and Role entry types. In the latter case, the junior roles are displayed.
-
Groups tab is available only for the User, Permission, and Target System entry types.
-
Accounts tab is available only for the User and Target System entry types.
-
Users tab is available only for the Role, Permission, Group, and Certification Campaign entry types.
-
Risks and Assignment cause tabs are available only for the User entry type.
For entries of the User entry type, if associated Role, Permission, Group, or Account history entry is not synchronized to the DirX Audit History Database, only summary information is shown.
Some tabs offer additional filtering options to help you quickly locate specific data.
At the bottom of each table, the footer displays the total number of data items. A page navigator and items-per-page selector are also available.
You can also check Changes only to display only modified values.
Check Highlight changes to visually emphasize changes with color and the exclamation mark ![]() icon.
icon.
By default, the data area includes two comparison time points: creation date, and termination date or current date, if the entry still exists. You can customize time points using the following controls:
-
Add time point
 icon – adds a new comparison column.
 -
Split interval
 icon – inserts a time point between two existing ones.
 -
Reset time points
 icon – restores the default time points.
 -
Show more options
 icon – opens a drop-down menu with advanced time point controls.
-
Previous day
 and Next day
  – quickly change the selected date.
 -
Update time point
 – updates the comparison time point.
 -
Remove time point
 – removes the selected time point from the table.
-
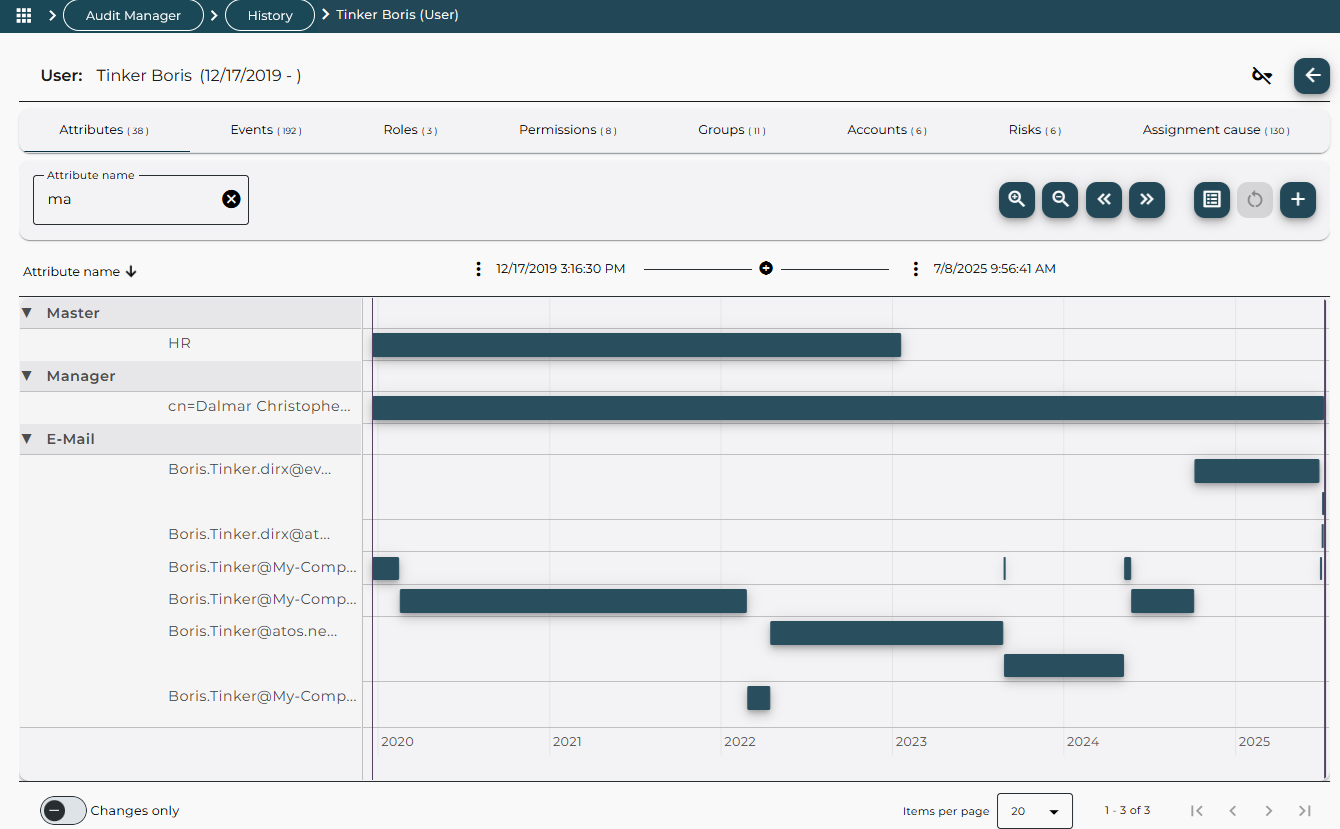
You can switch from the table view to a graphical timeline view by clicking the Show timeline
![]() icon in the table header.
The timeline view presents the same historical data as the table, but in a graphical format, making it easier to monitor changes over time.
Attribute changes are represented as lines, showing how values evolve.
Comparison time points can be added just like in the table view.
icon in the table header.
The timeline view presents the same historical data as the table, but in a graphical format, making it easier to monitor changes over time.
Attribute changes are represented as lines, showing how values evolve.
Comparison time points can be added just like in the table view.
Use the navigation icons in the header to adjust the timeline display:
-
Zoom in / Zoom out – adjust the scale of the timeline.
-
Backward / Forward – move the timeline view backward or forward in time.
-
You can also drag the timeline using your mouse for quick navigation.
-
Hovering over a line displays a tooltip with the time validity of the attribute.
-
Clicking on a line reveals the attribute value at that time.
-
To return to the table view, click the Show table
 icon in the timeline header.
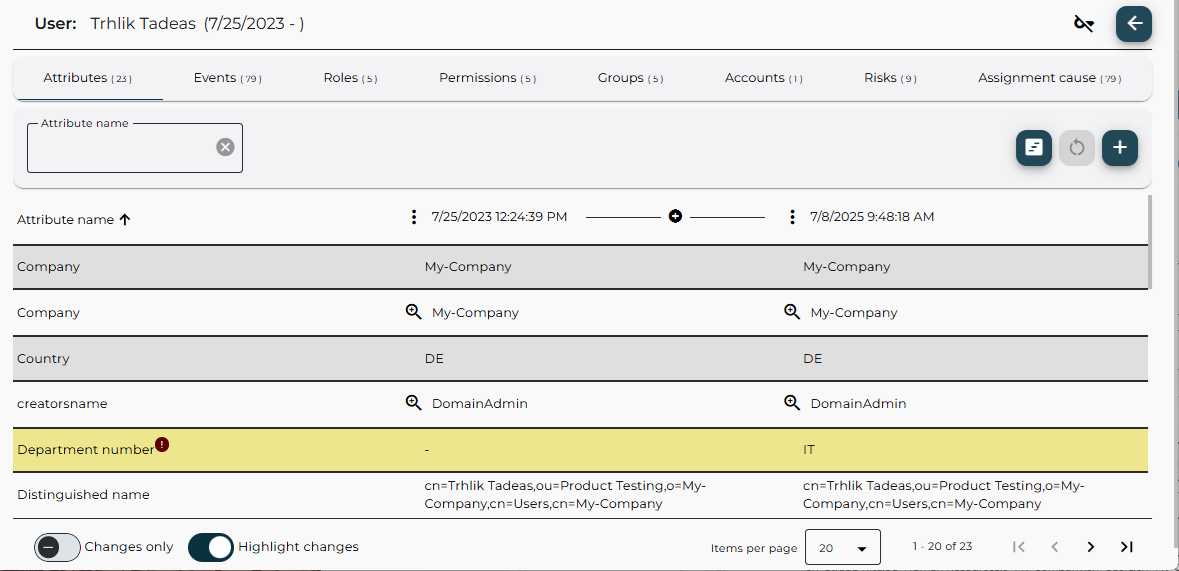
The Attributes tab
The Attributes tab presents a detailed comparison of attribute values across selected time points.
It is structured to enhance readability and usability, especially when dealing with large datasets.
The table is divided into Attribute name column and one or more attribute value columns, one for each selected target date.
For clarity, relative attribute names are displayed, for example Distinguished name.
The tooltip on each name shows the technical attribute name, for example dn.
It is also worth mentioning that not all synchronized entry attributes are displayed in the Attributes tab – some information may be available in other entry tabs such as Groups, Roles, etc. A perfect example is the user entry where the dxrPrivilegesGrantedLink attribute is not displayed and the user privileges information is available in separate Roles, Permissions and Groups tabs.
You can sort the table by Attribute name in ascending or descending order.
Use the Attribute name filter field to quickly locate specific parameters.
This filter is also available in other tabs and is recommended for large datasets, for example many users in a role.
Use the Clear ![]() icon to reset the filter field.
icon to reset the filter field.
Some attributes may contain a large number of values, such as dxrGroupMemberAdd or dxrGroupMemberOK.
To maintain readability, the number of displayed values is limited.
If the total exceeds the configured maximum, the total count is shown at the end of the list and a note indicates how many values are hidden.
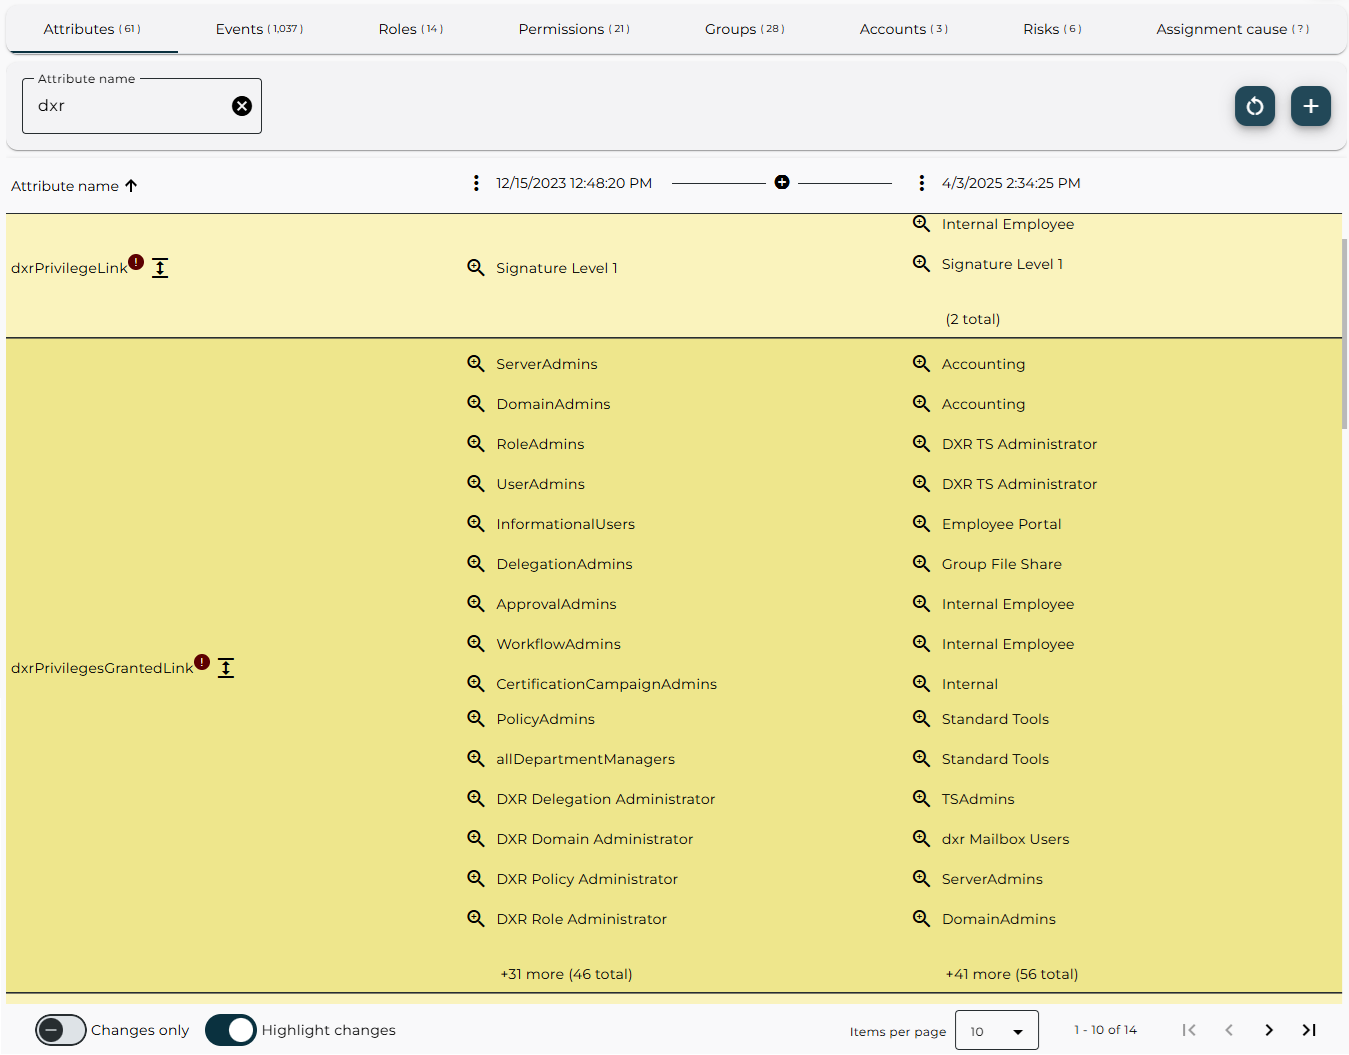
To view the complete list, click the Show and compare all values ![]() icon next to the attribute name.
This opens a new window displaying all values for that attribute.
A filter field is available for quickly searching within the values.
The table footer shows the total number of data items, a page navigator and a drop-down menu to adjust the number of items displayed per page.
icon next to the attribute name.
This opens a new window displaying all values for that attribute.
A filter field is available for quickly searching within the values.
The table footer shows the total number of data items, a page navigator and a drop-down menu to adjust the number of items displayed per page.
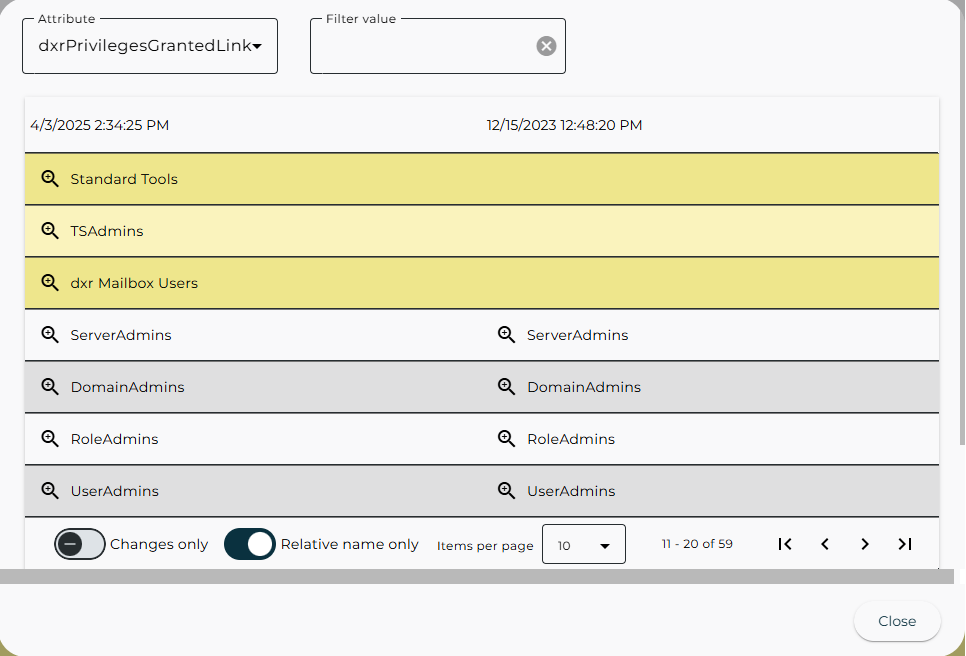
To refine your view and focus on relevant data, the Attributes tab offers several powerful filtering options:
-
Changes only – displays only attributes with changed values across the selected time points.
-
Relative name only – displays relative names instead of full Distinguished Names (DNs), improving readability.
-
Filter value – searches for specific attribute values. The filter uses a “Contains” comparison operator. For example, entering “Admin” returns all values that include “Admin” in the full DN.
Some attribute values are references to other entries in the system.
Click the Show Details ![]() icon next to a referenced value to open the history entry details for that referenced entry.
This allows you to seamlessly explore related entries and understand the broader context of changes.
icon next to a referenced value to open the history entry details for that referenced entry.
This allows you to seamlessly explore related entries and understand the broader context of changes.
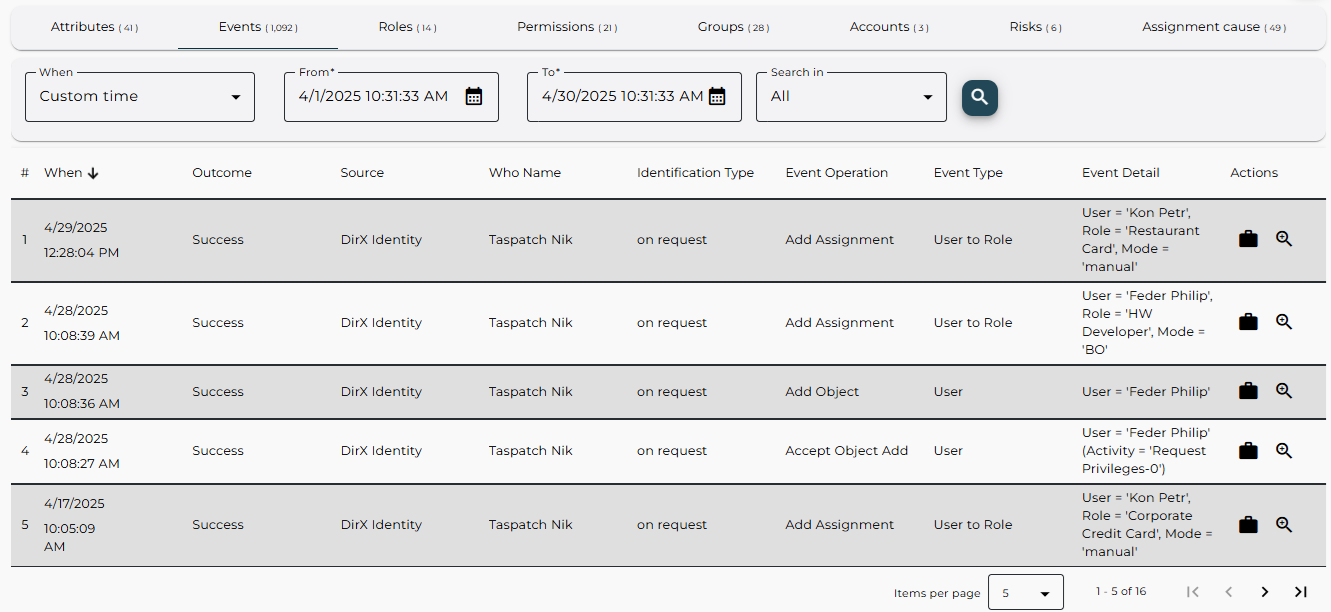
The Events tab
The Events tab displays all audit events related to the selected history entry.
The default filter is:
-
When set to Any time,
-
Search in set to All.
The filter included the following fields:
-
When – filters audit events by time period:
-
Relative: Previous Year, Previous Month, Month to date and so on.
-
Absolute: Custom Time to define a specific range using the From and To fields. Timestamps are rounded to the nearest second. For example, to find an audit event at “4/4/2025 2:24:18.408 PM”, set To to at least “4/4/2025 2:24:19 PM”.
-
Any time: No time filter applied. The fields From and To are not visible in this case.
-
-
Search in – filters events by the attribute to search in:
-
Who, the actor who triggered the event,
-
What, the object affected,
-
All for both Who and What.
-
This helps narrow down results when working with a large number of audit events.
The audit events are presented in the same format as the Audit Analysis results.
To view more details about a specific related event, click the Show details ![]() icon. To return to the previous results list, click the Back
icon. To return to the previous results list, click the Back ![]() icon in the top-right corner of the page.
icon in the top-right corner of the page.
Note: If audit message data has been purged from the DirX Audit Database, some additional information or the original message may no longer be available in the Event Details window. Similarly, if related audit messages have been purged, the list of related events may be incomplete.
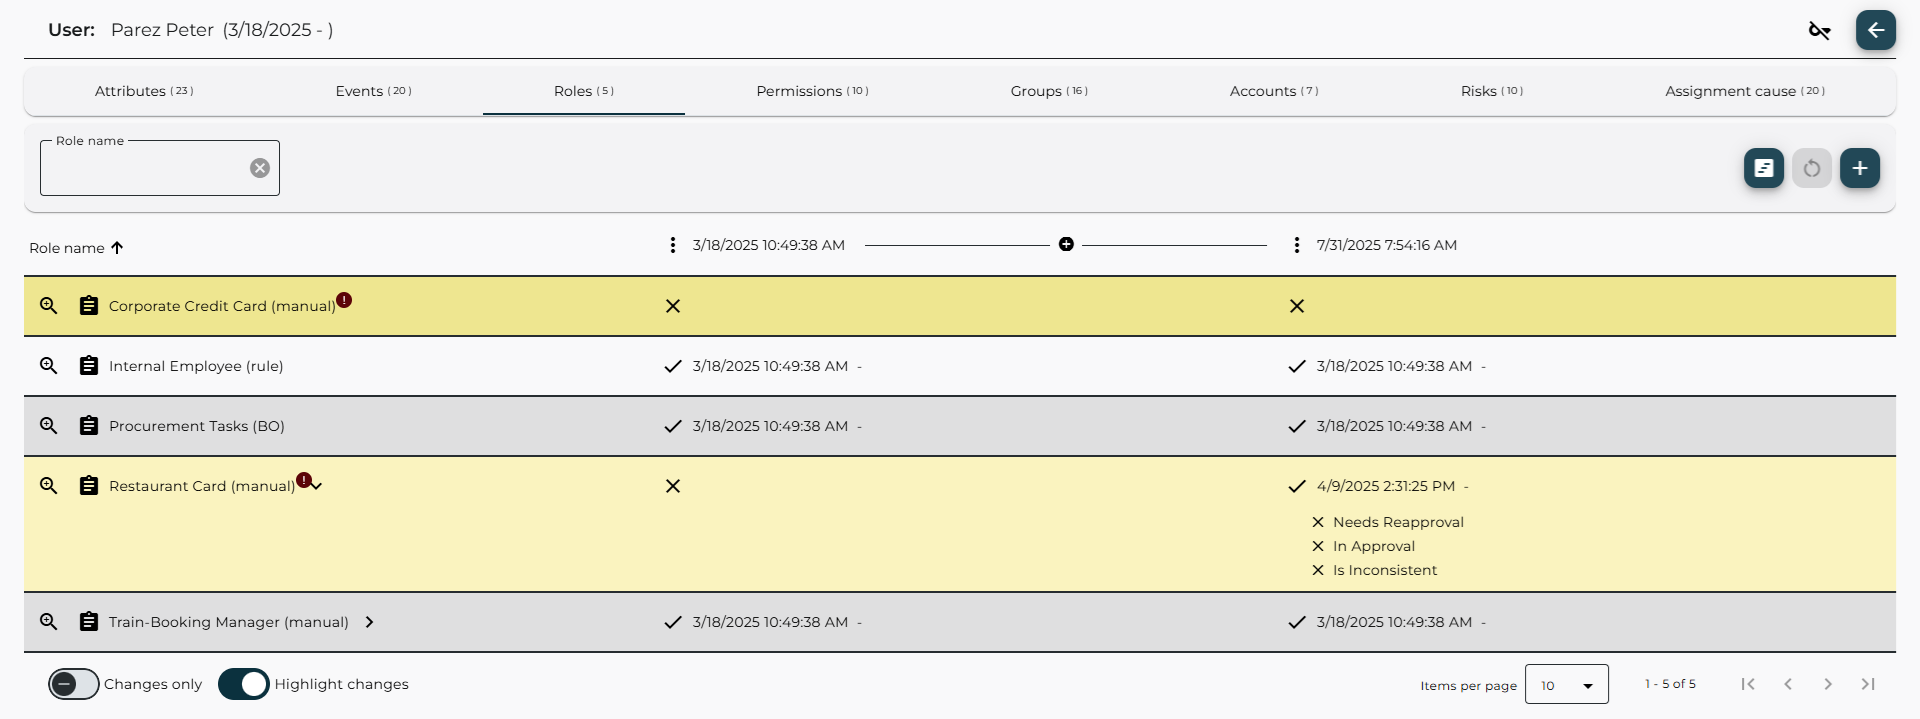
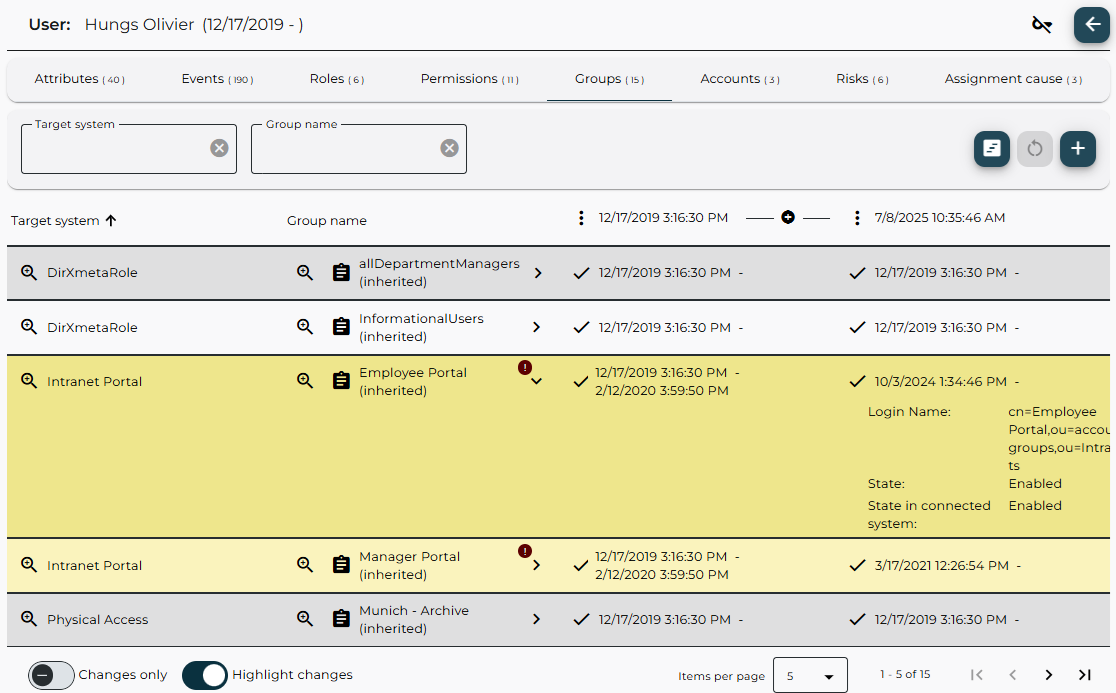
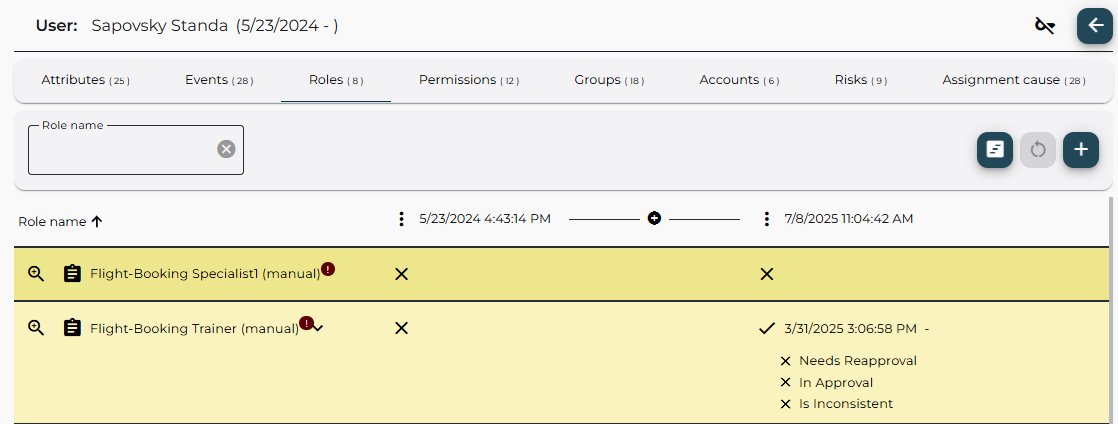
The Roles, Permissions, Groups and Accounts tabs
Roles, Permissions, Groups, and Accounts tabs are available for User history entries and are structured differently from the standard attribute-based tabs to better represent assignment relationships and their metadata. Each tab displays a list of assigned items: roles, permissions, groups, and accounts.
The Name column may include:
-
assignment mode for privileges: rule, BO, manual, inherited,
-
target system name for groups and accounts.
Each comparison time point column shows:
-
whether the assignment existed at that time,
-
additional assignment data such as:
-
start date and end date,
-
needs re-approval, in approval, and is inconsistent flags,
-
role parameter values for manual user to role assignments,
-
validity period, for user to privilege assignments,
-
state and connected system state for groups and accounts,
-
login name for accounts.
-
These tabs are analogously structured for history entries of the Role and Permission entry types.
Click the Expand row ![]() icon next to an item’s name to view its state and properties.
icon next to an item’s name to view its state and properties.
Click the Show assignment cause ![]() icon next to a privilege name to open the Assignment cause tab directly for that item.
icon next to a privilege name to open the Assignment cause tab directly for that item.
These tabs may include filter fields to help you quickly search through large datasets, for example, many users in a role or many accounts in a target system.
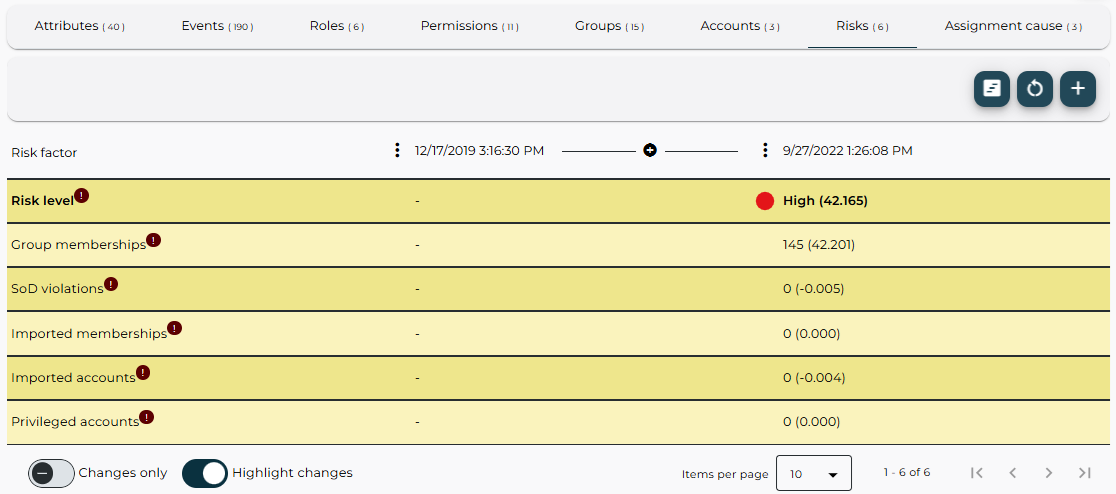
The Risks tab
The Risks tab displays user risk data derived from DirX Identity risk factors and overall risk values. These values are synchronized from the DirX Identity store into the DirX Audit Database, along with other user-related data. The tab provides insight into potential compliance or security risks associated with the user, based on predefined risk models and factors. This tab is especially useful for auditing and monitoring users with elevated access or unusual activity patterns.
The Assignment cause tab
The Assignment cause tab displays the causing events that led to the assignment of a selected privilege.
This helps trace the origin and rationale behind privilege assignments.
In the last Actions column, click the Show related events ![]() icon to open a list of contextually related audit events.
These events are correlated with the selected audit event to provide a broader view of the assignment context.
For details, see the section “Viewing Related Audit Events”.
icon to open a list of contextually related audit events.
These events are correlated with the selected audit event to provide a broader view of the assignment context.
For details, see the section “Viewing Related Audit Events”.
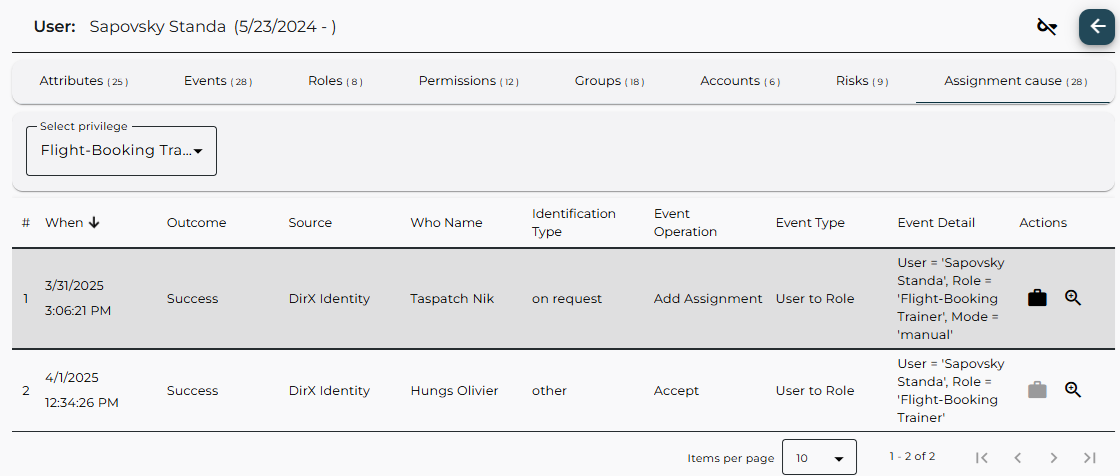
While browsing the Roles, Permissions, or Groups tabs, you can directly switch to the Assignment cause tab for a specific privilege by clicking the Show assignment cause ![]() icon next to its name.
This opens the Assignment cause tab pre–filtered for the selected privilege, streamlining your investigation.
icon next to its name.
This opens the Assignment cause tab pre–filtered for the selected privilege, streamlining your investigation.
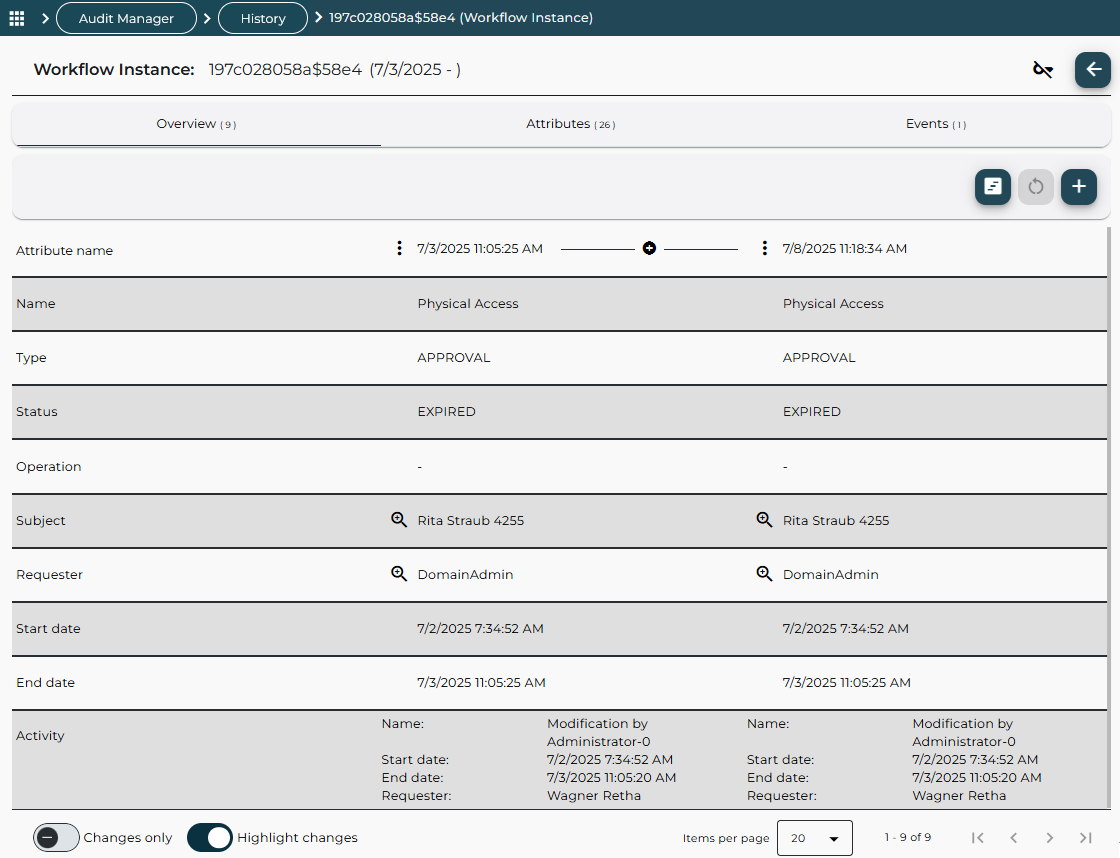
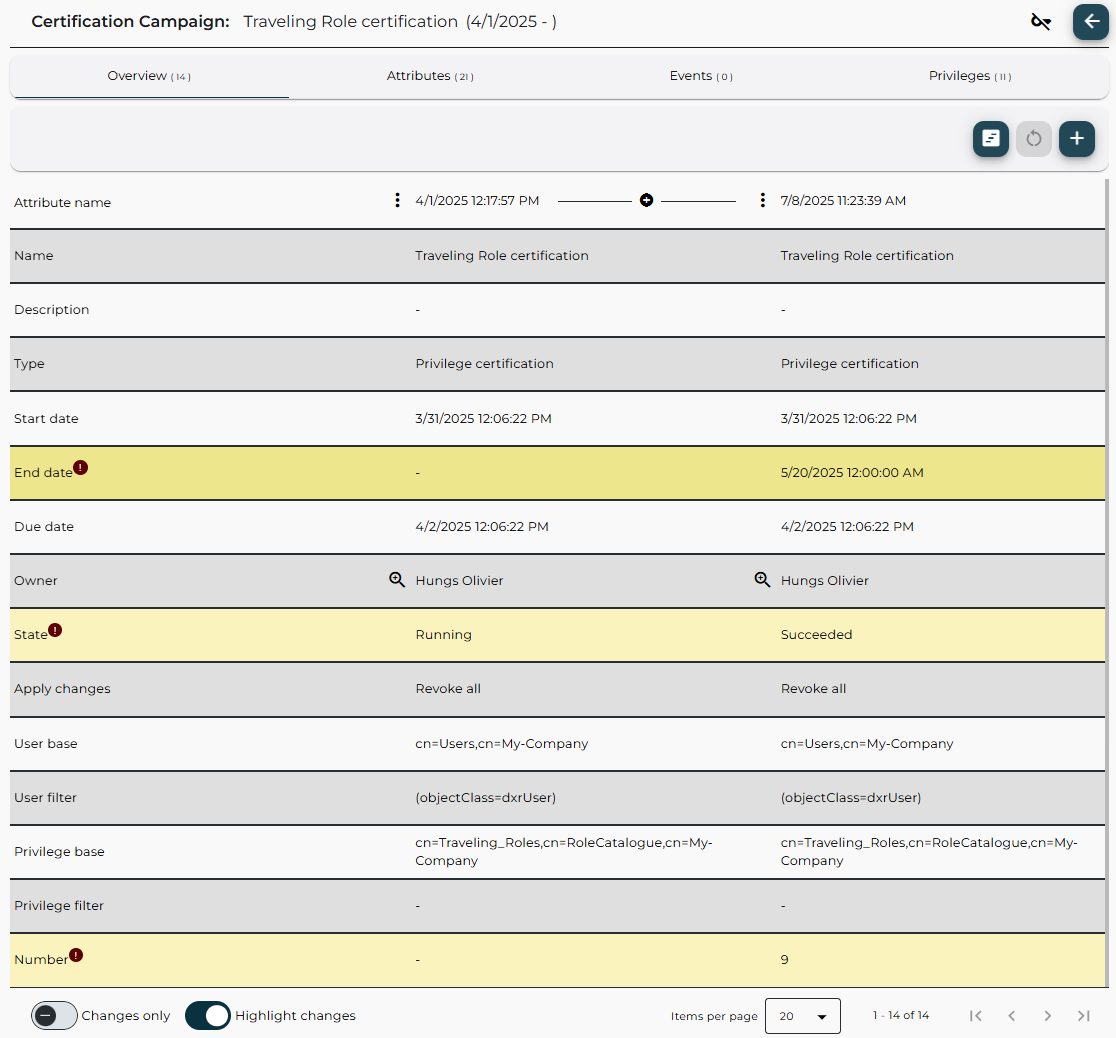
The Overview tab
The Overview tab is available only for history entries of the Workflow Instance, Certification Campaign, and Certification Assignment Change history entry types. This tab serves as the default view for these entry types and provides a high-level summary of key information:
-
name, (workflow) type, status, operation, subject, requester, start date, end date, and related activities for Workflow Instances,
-
name, description, type, start date, end date, expiration date, owner, state, and so on for Certification Campaigns,
-
start date, end date, reason, and so on for Certification Assignment Change.
This tab helps users quickly understand the context and progress of workflows and certification processes without needing to navigate through detailed attribute or event data.
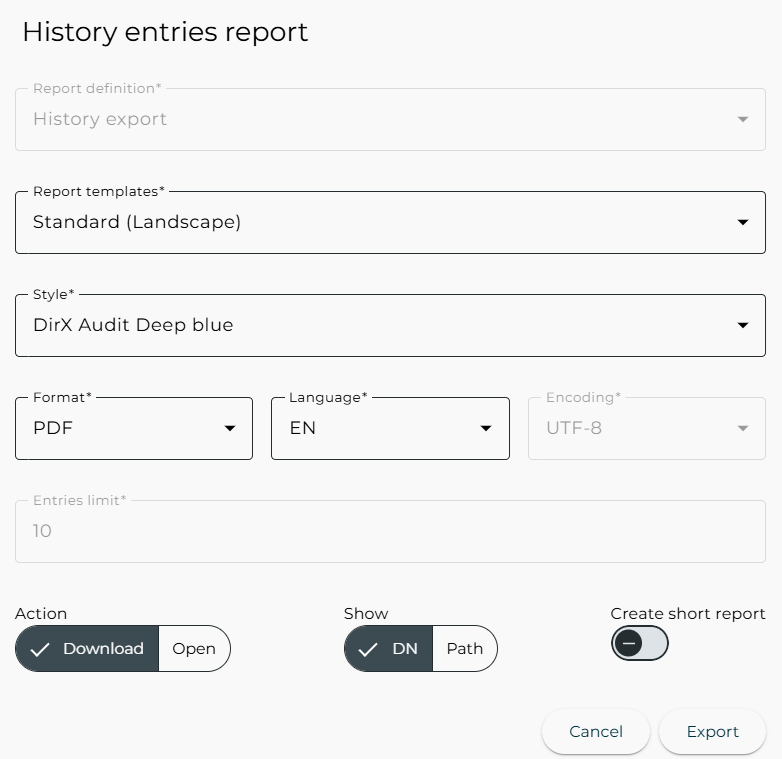
Exporting History Entries
To export history entries displayed in the search results table into a report-formatted file, click Report in the filter definition area. The History entries report dialog appears, allowing you to configure the export settings:
-
Report definition – Select a predefined report definition to structure the exported data.
-
Report templates – Choose a report template that defines the layout and formatting of the report.
-
Style – Select the visual style to apply to the report.
-
Format – Choose the file format, such as: PDF, CSV, Microsoft Word formats (DOCX, RTF), and others.
-
Language – Select the language for the report content.
-
Encoding – Choose the character encoding, for example, UTF-8, Big5, EUC-JP.
-
Entries limit – Defines the number of rows to include in the report.
-
Action – Choose what to do with the report file:
-
Download – Save the file directly.
-
Open – Open the report in a new browser tab.
-
-
Show – Choose whether to display DN (distinguished name) or Path in the report. The default is DN.
-
Create short report – Enable this to generate a summary report. It combines multiple history entry versions, for example, same user with different DNs, into a single line. If disabled, all versions are listed individually.
Click Export to generate the report. Click Cancel to exit the dialog. After clicking Export, your browser may prompt you to open, save, or cancel the report file download.