Perform SSO
Description
This scenario covers the situation in which a single request at the SingleSignOn REST API is sent containing values for Form authentication method. This request demands the authentication with given user parameters, meaning username/password credentials and the authentication of the requesting entity is done implicitly. In successful scenario we receive the SSO response with session token.
Each request creates a single new session. None of the sessions are used in further communication, however, all of them remain stored in the session cache memory.
Deployment Diagram
The deployment is as described in General Deployment Diagram.
Sequence Diagram
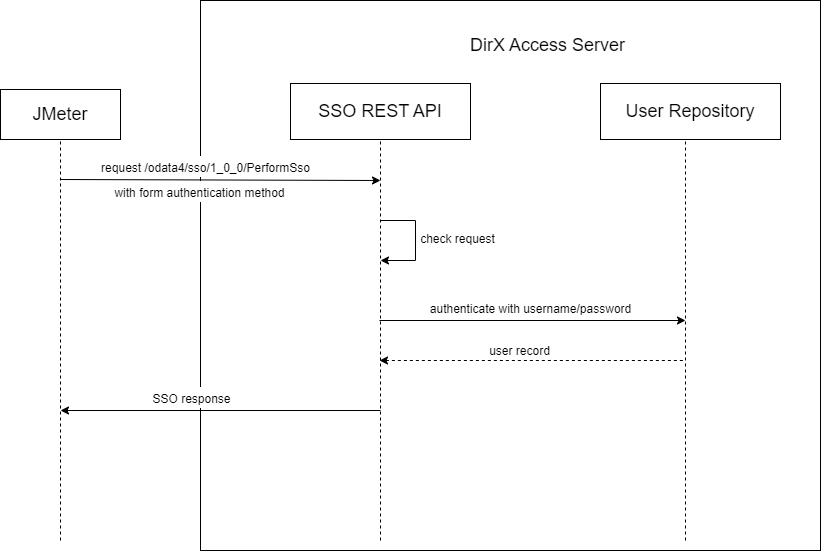
The Figure 1 depicts simplified iteration of the test focusing on Perform SSO flow, it does not include details of SSO Service and Form authentication.
Considered Influence Factors
The fact the SSO response generated by the first request is not used with any subsequent request renders many configuration parameters irrelevant for the performance of this scenario. The computational complexity of the atomic task itself emphasize the importance of memory configuration with respect to both, the JVM memory and the cache memory.
Chosen Testing Types
Maximal Performance State
Results
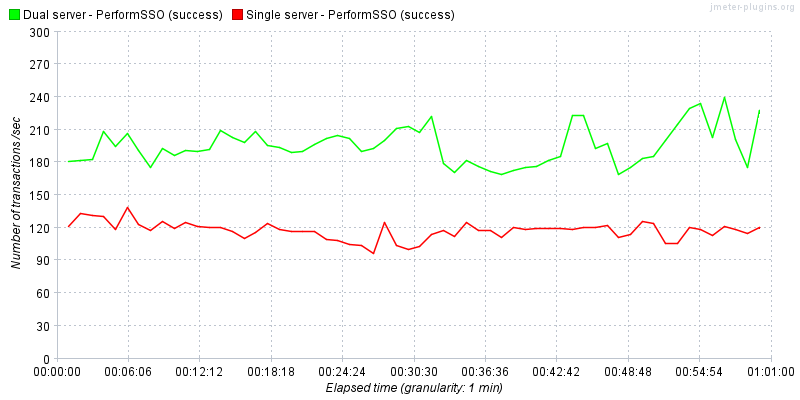
The Figure 2 depicts the values collected when performing this testing scenario in both, single and dual server deployments. With the correct configuration of the load balancer, it is noticeable that the throughput almost doubles with the addition of the second server.
The Figure 2 also depicts the almost constant throughput with regards to the number of existing SSO sessions in order of hundreds of thousands. This is valid for both single- and multi-server deployment.
Recommended/Expected Values
Values shown in Figure 2 have been observed on a several different projects and are generally believed to be the values to aim to when configuring the system.
Testing Tool Input
The JMX file that can be imported and (with marginal changes dependent on the environment parameters) used for testing in the target environment is enclosed below.
Variables
The JMX file should be updated to match your environment.
Open the JMX file in JMeter, select
Test Plan → Thread Group and update:
-
CSV Data Set Config→Filename- a CSV file containing<user name>, <password>rows used for authentication. -
HTTP Header Manager→Content-Type- a type of content in HTTP request (application/json). -
SERVER1_HOST→Path- DirX Access server 1 path. -
SERVER1_PORT→Port- DirX Access server 1 port number. -
SERVER2_HOST→Path- DirX Access server 2 path. -
SERVER2_PORT→Port- DirX Access server 2 port number.
Unstable Environment
Results
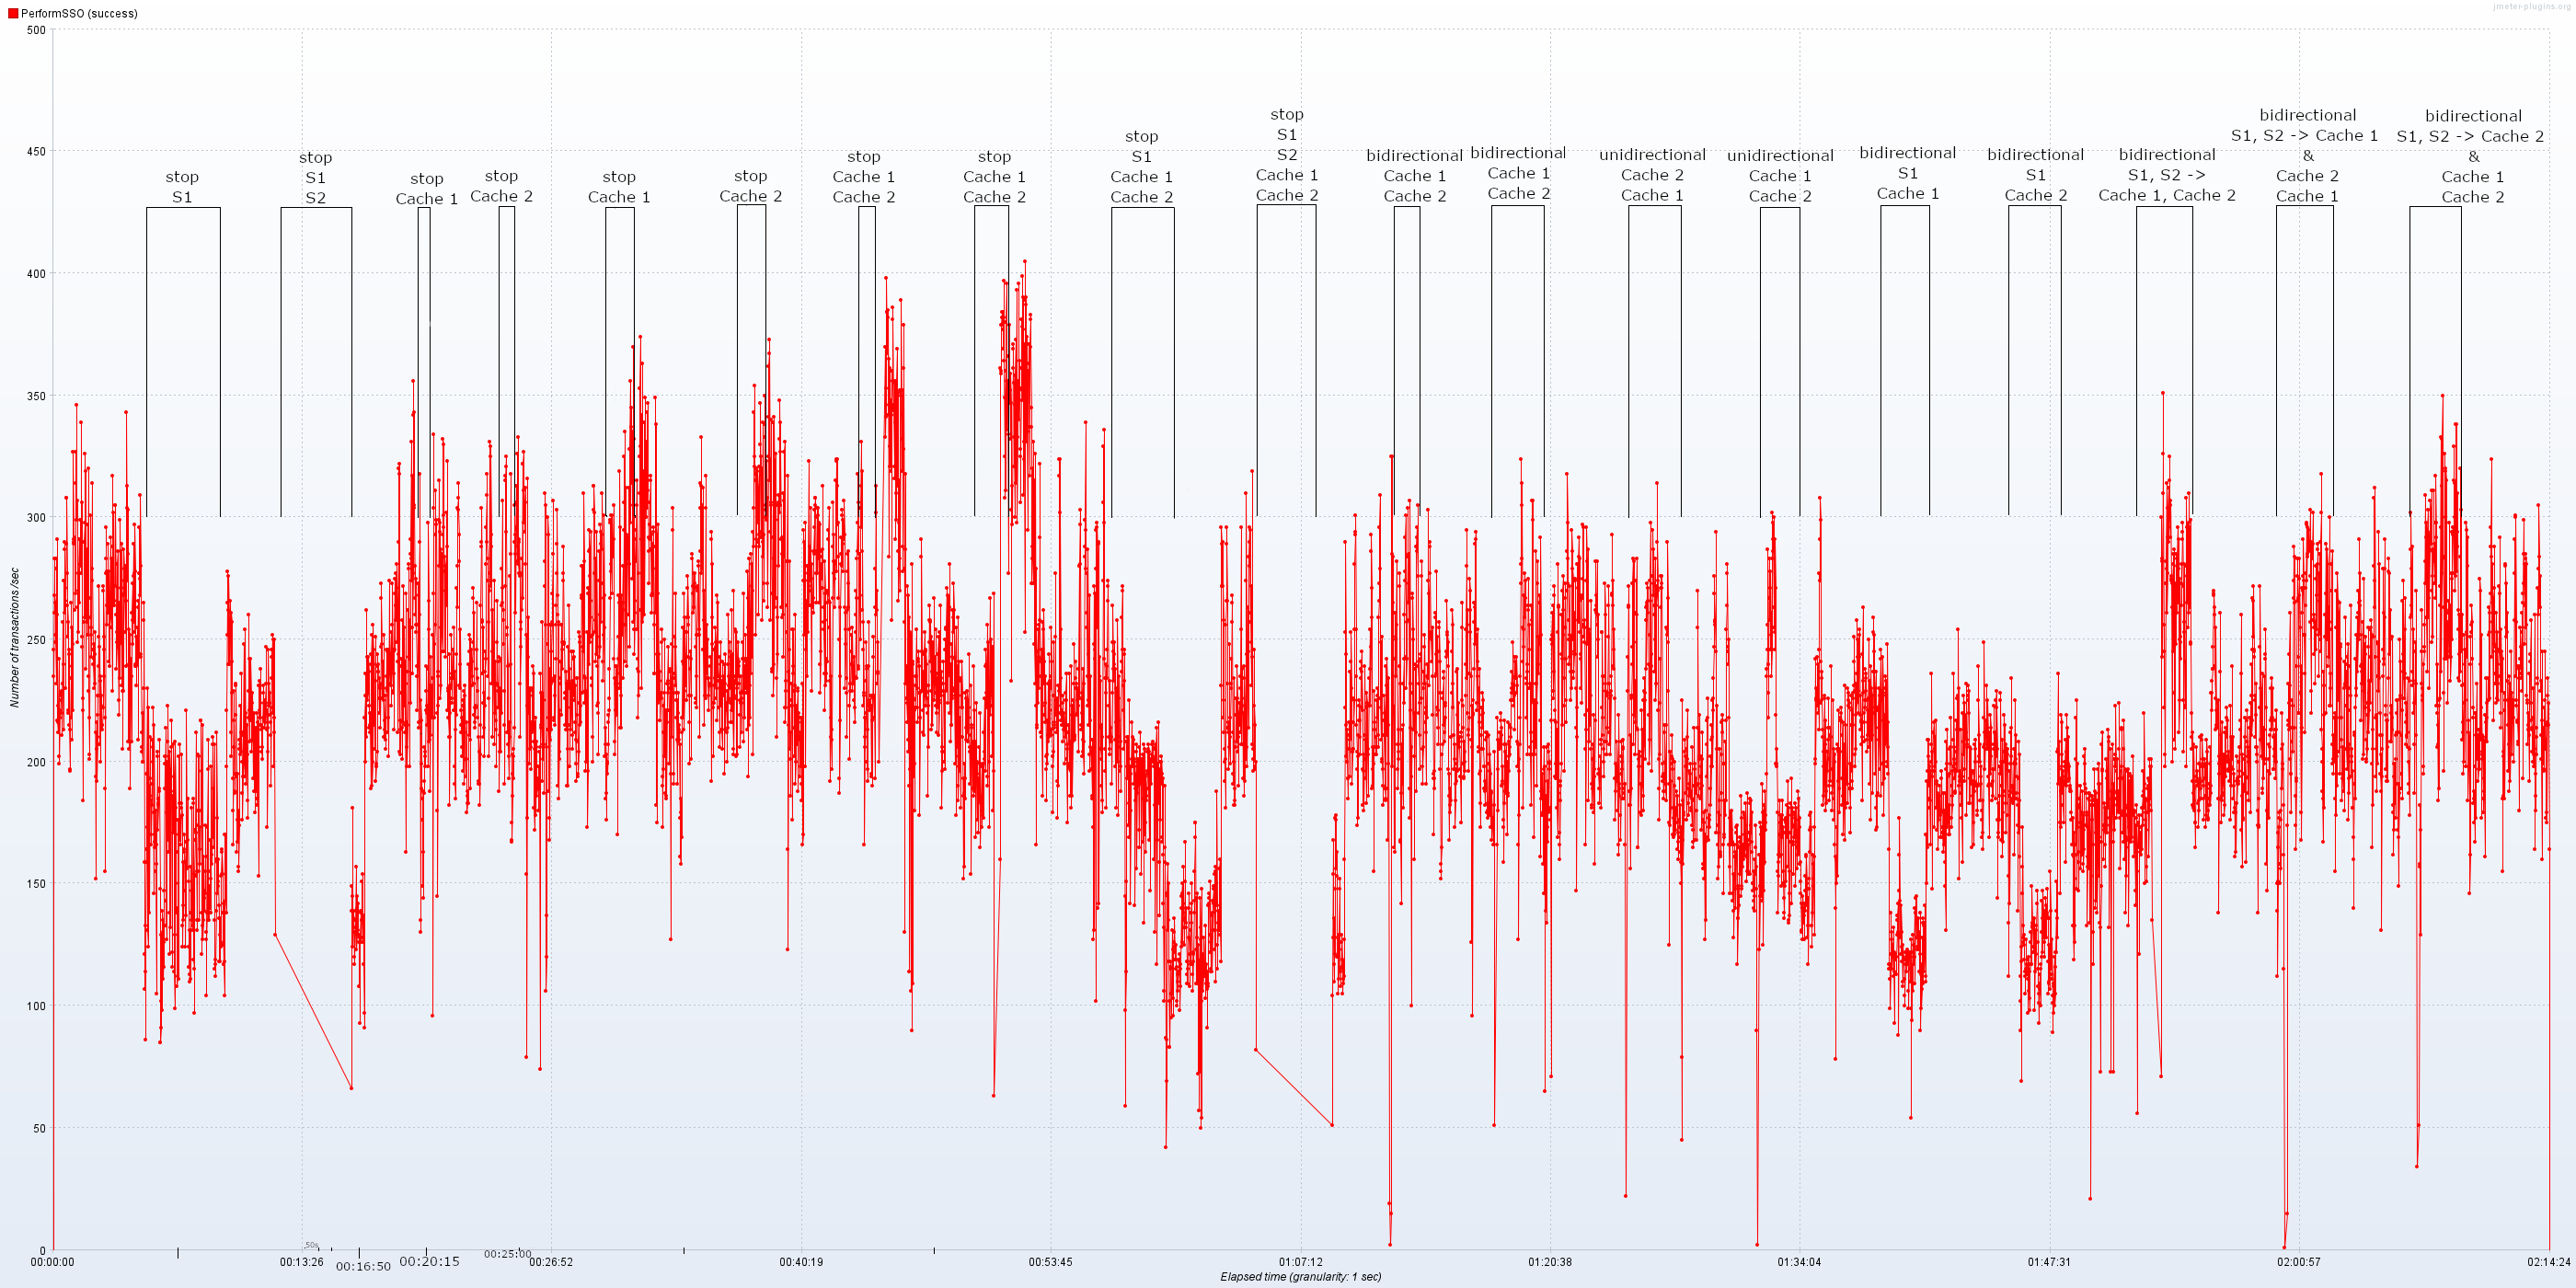
The Figure 3 depicts the behavior of this testing scenario in an unstable environment. The expected behavior, also clearly seen in the graph, is that when a system is fully functional after previous malfunction, the throughput increases back to a stable value. This graph depicts successful requests only.
Graph contains annotations of unstable behavior. First part of our Stability testing consists of turning off and on our nodes (DXA Servers and DXA Cache Servers). Testing in second part uses software to simulate network instability. The whole stability testing scenario takes 2 hours and 14 minutes. DXA nodes and their corresponding graph annotations are depicted by following table:
| DirX Access node | Graph annotation |
|---|---|
DirX Access Server 1 |
S1 |
DirX Access Server 2 |
S2 |
DirX Access Cache Server 1 |
Cache 1 |
DirX Access Cache Server 2 |
Cache 2 |
In the first part, we focus on DXA Servers which show their ability to process requests with both, one or no servers running. This behavior could be seen on Figure 2, but here we focus on the return to the original throughput. Next testing focuses on DXA Cache Servers and how they affect the Perform SSO behavior. Here we focus on time at which the cache servers were turned back on. With this we are testing the assumption that none of our servers or cache servers will notice that the other cache servers went down. While testing this, we need to keep in mind that one cache server is configured as leader (Cache 1) and the other as follower (Cache 2). Based on the graph we can see, that turning cache server down results in lowering the throughput, but only for a moment. If we turn of both cache servers, we then reach higher throughput but only for a brief moment.
Second part uses software to simulate network instability, but our goal here is not to cut off specific node and interrupt every communication attempt, but to interrupt the communication between some nodes.
Graph annotations describe the way in which the communication is interrupted.
In case of bidirectional we interrupt communication between mentioned nodes and unidirectional shows that the first mentioned node cannot communicate with the second mentioned node, but the other way is still possible.
Last three annotations are a bit more complex than the previous ones.
For example, let’s pick the last annotation:
bidirectional S1, S2 → Cache 2 & Cache 1 Cache 2 means that both DXA Servers cannot communicate with Cache 2 and Cache 2 cannot communicate with them, but DXA Servers can communicate with each other and Cache 1, the part after the & represents that DXA Cache Servers cannot communicate with each other, but Cache 1 can communicate with DXA Servers.
Last few minutes on the graph concludes our testing round and shows how our testing environment is back to its original values. The whole stability testing shows that our implementation of performing SSO recovers from every simulated instability of network environment.