Monitoring DirX Directory
This chapter describes how to use the monitoring tools provided by DirX Directory, including information about:
-
How to monitor LDAP and DAS MIBs.
-
How to use LDAP extended operations for monitoring issues.
-
How to use SNMPv2 traps for monitoring issues.
-
How to use the DirX Directory Nagios plugins to monitor DirX Directory processes and service and system resources within a Nagios® Core™ monitoring system.
-
How to use the DirX Directory Supervisor to monitor operations in floating master configurations.
-
How to use LDAP and DSA auditing.
-
How to use diagnostic logging.
-
How to monitor DirX directory database consistency and operating issues.
Monitoring the DSA MIBs with dirxadm
When a DSA is started, the DirX Directory service begins to write statistical information about the DSA and other OSI applications into two in-memory MIBs:
-
The Network Services, or Application MIB
-
The Directory, or DSA MIB
DirX Directory administrators can monitor the performance of DirX Directory by periodically examining the data in these MIBs.The tools for examining the DirX Directory MIBs include:
-
The dirxadm nmi object and its operations
-
The LDAP extended operations for DirX Directory MIB display available through the dirxextop command (see the dirxextop section in the DirX Directory Administration Reference for details)
-
DirX Directory Manager’s Monitor view (see the DirX Directory Manager Guide for details)
The next sections describe how to use dirxadm nmi commands to display the Application and DSA MIBs. The sections also provide some hints on how to use the data within the MIBs to evaluate DirX Directory performance. For a description of all the dirxadm nmi operations, see the dirxadm section in the DirX Directory Administration Reference.
Examining the Application MIB
The Application MIB is a common storage area to which statistics about all OSI applications are written. The Application MIB consists of two tables:
-
The association table, which stores statistics about the associations (connections) made by OSI applications. Information in the association table includes a count of the number of associations made and information about the current association, such as the protocol in use, the name and type of the application that opened the association and the duration of the association.
-
The application table, which stores information about the OSI applications making the associations, and stores statistics about their associations with other applications. Information in the application table includes the names and version numbers of the OSI applications, their accumulated inbound and outbound associations, and the current number of associations they have open. Although there are potentially many OSI applications in the network for which this table should contain entries, the DirX Directory DSA holds information about only one OSI application - itself. Consequently, when you view the application table with dirxadm, you see just one table entry, which is that of the DirX Directory DSA.
The Application MIB provides details about the DSA installation, such as the name and version number of the DSA installation (for example, DirX and 1.0), the application entity title, (which is the distinguished name of the DSA), and the time the DSA was last restarted. It also provides information that you can use to determine how intensively the DSA has been used and to make decisions about the installation based on this information. For example, if the Application MIB shows a large number of inbound associations, you may want to recommend to management that they charge usage fees for DSA operations and request larger machines for improved support of the DSA installation.
To display the entire Application MIB, use the dirxadm command:
nmi show -mib APP -pretty
To display just the application table portion of the Application MIB, use the dirxadm command:
nmi show -mib APP -table APPLICATION -pretty
To display just the association table portion of the Application MIB, use the dirxadm command:
nmi show -mib APP -table ASSOCIATION -pretty
Using the -pretty option with these commands generates more easily readable output. You do not need to use the -pretty option if you are planning to redirect the output to another program, for example, a table-formatting program.
Examining the DSA MIB
The DSA MIB provides statistics about the DSA since it was last started. The DSA MIB consists of three tables:
-
The entries table, which provides information about the entries in the DSA’s DIT
-
The interaction table, which provides information about the interactions between this DSA and other DSAs
-
The operations table, which provides information about the operations initiated by users bound to the DSA, by other DSAs bound to the DSA, and by the DSA itself.
To display the entire DSA MIB, use the dirxadm command:
nmi show -mib DSA -pretty
Using the -pretty option with these commands generates more easily readable output. You do not need to use the -pretty option if you are planning to redirect the output to another program, for example, a table-formatting program.
Examining the Entries Table
The entries table provides statistics about the entries in the portion of the DIT owned by the DSA. This information includes:
-
A count of the total number of entries mastered by the DSA
-
A count of the total number of entries shadowed by the DSA
-
Caching statistics; for example, a count of read operations on shadow entries (slave hits)
To display just the entries table, use the dirxadm command:
nmi show -mib DSA -table ENTRIES -pretty
You can use the information in the entries table to keep track of the size of the DIT managed by the DSA.
Examining the Interaction Table
The interaction table provides information about outgoing interactions with other DSAs (one set of information per DSA). You can use this table to monitor the success of DSP and DISP interactions. If the table indicates failures, you can consult the exception log file (named USRprocessid) to determine the cause of the failure.
To display just the interaction table, use the dirxadm command
nmi show -mib DSA -table INTERACTION -pretty
Examining the Operations Table
The statistics in the operations table include:
-
Counts of the anonymous and authenticated binds performed to the DSA and a count of the bind security errors that have occurred
-
Counts of the DAP operations, such as read, compare, search, and so on, performed on the DSA
-
Counts of the referrals and chainings returned
-
Counts of security errors and DSA errors that have occurred
To display just the operations table, use the dirxadm command:
nmi show -mib DSA -table OPERATIONS -pretty
The statistics about DAP operations in the operations table can provide you with a profile of how users are using the DSA.For example, you can compare how many occurrences of one type of operation there are compared to occurrences of other types, for example, modifies to searches.
The statistics about chaining and referrals in the operations table can help you to evaluate your DSA configuration.For example, a high number of chains or referrals returned indicates that you may need to shadow some other DSA.
Finally, the error statistics in the operations table can help you to evaluate the DSA’s security.For example, a high number of rejected inbound associations in the operations table might indicate that unauthorized and potentially untrustworthy users are trying to connect to your DSA.A high bind security error count in the operations table could mean that users are trying to guess passwords.
Initializing the DirX Directory MIBs
The DirX Directory service continues to write information to the Application and DSA MIBs until the DSA is stopped.Consequently, you initialize the DirX Directory MIBs by stopping the DSA with the dirxadm stop command, and then restarting the DSA with the dirxadm start command.The sys (dirxadm) reference page in the DirX Directory Administration Reference provides further information about the dirxadm start and stop commands.
Monitoring the LDAP MIBs
When the LDAP server starts, it automatically creates several MIB tables that contain information about static and dynamic processing data.The tables are automatically maintained and need no further administration.These tables are:
-
The static table - Use this table to examine quickly most of the configuration settings of a running server, such as port numbers, server type, supported controls and so on.
-
The total table - Use this table to get information about the number of processed operations in total or detailed by means of operation types.For example, this table counts how many operations are processed, how many binds, searches, adds, and so on.
-
The current table - Use this table to get information about the current status of how many LDAP/DAP connections are established, the current cache status, the thread pool activity and about the established socket connection states, including:
-
The assoc table - provides a detailed listing of important LDAP connection parameters and provides information about operations that are currently running (for example, search parameters).
-
The env table - contains all the environment variable settings that are currently visible to the LDAP server
You can access all of these tables using the LDAP extended operations ldap_mib_static, ldap_mib_total, ldap_mib_current, ldap_mib_assoc, ldap_mib_env and ldap_mib_dump.(See the dirxextop reference page in the DirX Directory Administration Reference for details.)
Monitoring DirX Directory with LDAP Extended Operations
DirX Directory administrators can also use the dirxextop command to run LDAP extended operations that display monitoring and diagnostic information about DirX Directory processes as well as perform some enable/disable functions.You can find a description of LDAP extended operations in Section 4.12 "Extended Operations" in the document Lightweight Directory Access Protocol (v3) RFC 2251, December 1997. The extended operations provided by DirX Directory are intended for support purposes and are described in the dirxextop reference page in the DirX Directory Administration Reference.
Some of these functions can also be performed via dirxadm, a DirX Directory command, or a system command; for example, dirxadm ldap audit info.However, rather than using internal RPC protocols and ports, as with dirxadm, LDAP extended operations are performed as LDAP client operations sent over LDAP(v3).If you are running a DirX Directory installation in a firewall configuration, dirxextop can be a better monitoring and diagnostic option because it uses a well-known LDAP port that is usually open in a firewall.
The dirxextop command performs a single LDAP extended operation.See the dirxextop reference page in the DirX Directory Administration Reference for details.
Monitoring DirX Directory with SNMPv2 Traps
SNMPv2 traps provide another mechanism for monitoring the DirX Directory service.An SNMP trap (also called an alarm) is an unsolicited message sent over UDP/IP to a SNMPv2 receiver application to notify it of specific situations.(See RFC 1155 and RFC 1905 for details.) DirX Directory can be configured to send out SNMPv2 traps on conditions that require administrator attention, such as security-related events or critical operational status.
Because UDP is a connectionless protocol, SNMP traps are lost if there is no receiver running and listening for them.As with any other UDP protocol, SNMP traps can be lost within a network under certain circumstances, such as dropouts or network congestion due to network overload or similar events.Therefore, the sender (DirX Directory, in this case) cannot determine whether the trap has successfully reached its receiver.This is a limitation of the underlying transport UDP, not of DirX Directory.
DirX Directory administrators can use DirX Directory SNMPv2 traps to monitor and detect problems in DirX Directory service operations.The traps that DirX Directory can send include:
-
Traps that indicate normal service processing, for example, starting and stopping server processes.
-
Traps that indicate temporary problems, for example lack of resources.
-
Traps that indicate permanent problems; for example, conditions that result in a server exit without restarting the server process.
-
Traps that can help to control DirX Directory service performance; for example, by indicating when a directory operation exceeds a specific time limit.
You (the DirX Directory administrator) are responsible for providing the application that receives the DirX Directory SNMPv2 traps. For example, on Linux systems, you can use the trapd daemon process of the netsnmp package. You can also use the DIRX-MIB.txt file (provided with DirX Directory) in your trap receiver application to provide more readable output of DirX Directory SNMPv2 traps; for example, trap names instead of OIDs.
To enable SNMPv2 traps:
-
Edit the SNMPv2 trap configuration file install_path/conf/snmptraps.cfg.This file is a template for SNMP settings, with all traps commented out.
-
Export the environment variable DIRX_SNMP=1 in the environment variable configuration file install_path/conf/dirxenv.ini.
For more information, see the chapter DirX Directory Files in the DirX Directory Administration Reference and the Guide for CSP Administrators.
The DirX Directory SNMPv2 implementation comprises only DirX Directory traps.
Monitoring DirX Directory with Nagios
Nagios is widely used to monitor the status of system hardware, applications and services and alert administrators when problems appear and also when they are resolved.
Nagios supports the concept of plugins for managing the details of the different resources that can be monitored in a given configuration.A Nagios plugin is a shell script, Perl script or binary that provides input parameters for specifying the targeted object to be checked - for example, how many processes run on a host - and provides input parameters for defining warning or critical levels that the administrator wants the plugin to monitor for the targeted object.
In the Nagios environment, the Nagios plugins interoperate with a main Nagios monitoring server.The monitoring server runs on a host (usually running Linux) and periodically polls the status of defined objects (hosts, services, applications) by invoking specialized plugins to gather the required monitoring data for this object.Each plugin is tailored to the object it monitors.When called by the Nagios server, the plugin evaluates the object’s status and returns it to the Nagios server.The Nagios server then displays this status graphically for each monitored object.
Nagios plugins can also return performance data about an object.Performance data is current data that is relevant to monitoring the performance of the object over time.While the status information returned to the Nagios server is volatile - it is replaced on each call to the plugin – performance data is intended to be collected over time and used for long-term trend analysis.The Nagios server saves the returned performance data in a database reserved to the monitored object and can display it in graphical format later on, for example via pnp4nagios.
Nagios provides standard plugins for monitoring network services, such as SMTP, FTP, POP3, and HTTP, and for monitoring host resources, such as processor load and disk usage.It also supports a simple plugin interface for creating own service-specific monitoring applications and integrating them into the Nagios environment.
DirX Directory provides a set of specialized Nagios plugins that can be used in an existing Nagios environment to monitor the status of DirX Directory service resources and DirX Directory process operations and collect statistics about these items for later performance analysis.
The DirX Directory Nagios plugins allow administrators to monitor important aspects of DirX Directory service operation with Nagios, such as:
-
The frequency of DirX Directory database backup operations
-
The capacity of DBAM devices configured in a DirX Directory installation
-
The operational status of the DBAM database
-
The operating mode of the DirX Directory service
-
Resources consumed by DirX Directory processes, such as CTX memory and file descriptors
-
The responsiveness of DirX Directory processes (the DSA and LDAP server) running in standalone and supplier-consumer replication configurations
-
Resource and operational statistics kept by the LDAP server in its MIBs and the changes to these counters over time
-
Proper administration of LDIF and shadowing agreements
-
Result sizes returned by LDAP search operations and the duration of LDAP client calls, categorized across incremental ranges of sizes and run times
The DirX Directory Nagios plugins provide input parameters for the user to specify warning and critical thresholds to be monitored for these DirX Directory service objects, offering DirX Directory administrators the opportunity to respond to problems detected by the plugins and displayed by the Nagios server before they become severe, and to track their resolution.
The DirX Directory Nagios plugins are delivered as full-function Perl-based executables that can be copied and then extended to address customer-specific DirX Directory monitoring requirements.For details about DirX Directory Nagios plugin configuration, setup, operation and calling syntax, see the DirX Directory Plugins for Nagios.For details about the Nagios Core monitoring application, see the See the Nagios documentation.
Monitoring DirX Directory with the Supervisor Scripts
High availability is often a key requirement of directory service deployments.DirX Directory supports both hardware-based and software-based solutions for high availability and failover, including floating master X.500 directory replication in the software layer and clusters and RAID arrays in the hardware layer.
For floating-master replication configurations, DirX Directory includes a software monitoring and recovery tool called the DirX Directory Supervisor that provides for continuous, periodic monitoring of shadowing-level and network-level connectivity between the DirX Directory service instances in the configuration and automatic recovery from many types of responsiveness problems.The goal of the Supervisor scripts is to ensure that a supplier DirX Directory database is always available in the floating-master configuration.
The DirX Directory Supervisor consists of the dirxsupervisor command that executes Tcl- and Perl-based scripts that DirX Directory administrators run on each DirX Directory service in the floating-master configuration.Each Supervisor script instance monitors a pair of DirX Directory service instances (DSA, LDAP server and DirX Directory database): the supplier and one of the consumers.
The scripts perform their responsiveness monitoring and recovery operations on supplier and consumer instances over LDAPv3, DAP/RPC, DSP/DISP and ping (Packet Internet Groper) and log the results of each operation for administrative notification.The following figure illustrates the Supervisor-to-DirX Directory service relationship and the monitoring/recovery protocols used.
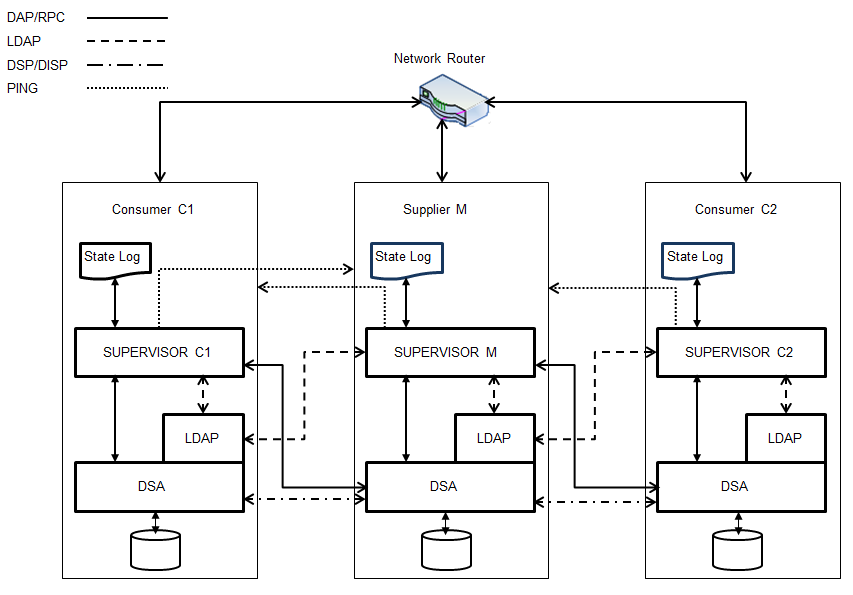
The next sections describe the monitoring and recovery operations in more detail and describe how to set up the Supervisor scripts. In the sections that follow, the set of Supervisor scripts is referred to as "the Supervisor".
Monitoring Operations
A Supervisor instance runs co-located on every DirX Directory service operating in the floating-master configuration. It monitors shadowing and network-level responsiveness between the local host and one remote instance.
The Supervisor has two modes of operation - supplier or consumer - depending upon the replication role of the co-located DirX Directory DSA. The Supervisor determines the co-located DSA’s role on startup and can automatically change its operating mode if the DSA role changes as the result of a dirxadm sob switch operation. Only one Supervisor instance at a time can operate in supplier mode.
A Supervisor instance monitors connectivity between a pair of DSAs in two ways:
-
By periodically directing asynchronous LDAP operations called "heartbeat operations" to the local DSA and to the remote partner DSA to monitor shadowing responsiveness.
-
By periodically sending ping commands to a network router (or to the remote partner DSA in the pair, if a router is not part of the configuration), to monitor network responsiveness.
Before each heartbeat operation, the Supervisor checks the co-located DSA’s role to make sure that a dirxadm sob switch operation has not occurred.
In supplier mode, the heartbeat operation consists of an LDAP bind and update operation to the local DSA that adds a timestamp to the description attribute of an LDAP entry that exists in the replicated part of the DIT, and a subsequent read/compare of the test entry on the remote consumer DSA. The DirX Directory administrator specifies the DN to be used for the bind and the target test entry to be modified as part of the Supervisor script setup process.
In consumer mode, the heartbeat operation consists of an LDAP bind and read operation on the local (replicated) test entry’s description attribute, using the same configured bind DN, and a subsequent read operation of the (master) test entry on the remote supplier DSA.
Recovery Operations
The Supervisor attempts to recover from connectivity problems detected by its monitoring operations in two ways:
-
By attempting to restart the DirX Directory service a number of times; this number is customizable during Supervisor setup.
-
By performing an emergency switch to transfer mastership of the DIT to the partner DSA, if repeated attempts to re-start the service fail.
The emergency switch is not performed until the number of service restart retries is exhausted or a certain network condition is satisfied to allow intermittent or short-term responsiveness problems like network outages to resolve themselves first.
In the event of an emergency switch:
-
There is always the possibility of data loss on the new supplier DSA, since it’s possible that the consumer DSA’s shadowed database copy was not completely synchronized with the old supplier at the time of the emergency switch.
-
A total update must be performed to the former supplier DSA once it is up and running again. If synchronous replication is in effect, the DSA on the new supplier automatically performs the total update once the old supplier is running as a consumer. If asynchronous replication is in effect, the DirX Directory administrators must perform the total update manually using dirxadm sob terminate and dirxadm sob establish operations.
For both emergency and non-emergency switches:
-
All LDAP update clients that are directed to the machine that hosts the old supplier may need to be redirected to the machine that hosts the new supplier.
-
All LDAP servers must be restarted to update their read-only/read-write status. You can do this by restarting them with different LDAP configuration subentries (the value of the LDAP Read Only Server (LROS) attribute of the LDAP configuration subentry controls the status).
These manual administrative procedures affect the Supervisor’s operating parameters, and you will likely need to change the settings in the Supervisor setup script setup_common_data.tcl accordingly. For example, you may need to update the Supervisor’s ldapPort parameter setting to the LDAP port number used on the new supplier’s host machine. Note that
The Supervisor cannot recover from problems like a corrupted database; problems like this require administrator intervention. As a result, it is a good idea to examine the Supervisor state logs carefully.
The next sections describe the problems that can be discovered by Supervisor monitoring operations and the general follow-up recovery procedures performed. See the section "Monitoring and Recovery Scenarios" for examples of the recovery procedures performed and the state logging that accompanies them on supplier and consumer sides. any change of the setup_common_data.tcl requires a supervisor restart. Also note that it is recommended to apply the same ldap port number on all LDAP servers for monitoring with the supervisor.
Recovering from Administrator-Initiated Switches
When a DirX Directory administrator switches the supplier manually, each Supervisor instance detects the DSA role change, automatically switches its role, and logs the incident. See Example 6 in the "Monitoring and Recovery Scenarios" section for an example of this procedure.
Recovering from Stopped or Unresponsive Consumers
When the consumer has stopped or is unresponsive:
-
Each Supervisor instance detects and logs the incident.
-
The consumer-side Supervisor attempts to restart the DirX Directory service.
-
The supplier-side Supervisor logs the replication problem for this consumer.
This recovery procedure is effective for consumer restart problems, heartbeat operation timeouts, and LAN outages. See Example 1 in the "Monitoring and Recovery Scenarios" section for an example of this recovery procedure.
Recovering from Stopped or Unresponsive Suppliers
When the supplier has stopped or is unresponsive:
-
Each Supervisor instance detects and logs the incident.
-
The supplier-side Supervisor attempts to restart the DirX Directory service a configurable number of times (the default is 3). If all of these restarts fail, it performs an emergency switch to its partner consumer and exits.
-
All remaining Supervisor instances automatically detect and adjust to the role change.
This recovery procedure is effective for supplier restart problems, heartbeat operation timeouts, and LAN outages. See Examples 1 and 2 in the "Monitoring and Recovery Scenarios" section for examples of this recovery procedure.
When the local DirX Directory service is successfully restarted, the DSA starts up as a consumer if an emergency switch was performed and you must manually restart the Supervisor.
The DSA starts up as the supplier again if the cause of its unresponsiveness was a short-duration network outage. In longer-term network outages where an emergency switch has been performed, this can lead to dual mastership errors, discussed in the next section.
Recovering from Dual Mastership Errors on Emergency Switches
Dual mastership errors (two supplier DSAs) are usually the result of a long-term local area network outage between the supplier and consumer instances that causes the consumer-side Supervisor to perform an emergency switch to the local DirX Directory service instance, which then runs as the new supplier. The old supplier, meanwhile, will continue to get updates from its locally connected clients, as will the new supplier on the other side of the outage.
When the network returns to service, there are now two supplier instances that claim ownership of the master database in the floating master topology. To recover from this problem, the supplier-mode Supervisors compare the timestamps of the two cooperating DSA tables. Generally, the supplier DSA resulting from the emergency switch has the newer cooperating DSA table, so the DirX Directory service on the instance with the older table is restarted to ensure that the DSA falls back to the consumer role on startup.
The DSA on the new supplier then issues a total update to the old supplier; this means that any updates made to this old supplier’s DirX Directory database during the network outage will be lost. The DSA only performs this automatic total update for synchronous shadowing configurations. See the chapter "Creating a Synchronous Shadow DSA" for an example of this configuration. For asynchronous shadow configurations, DirX Directory administrators must perform the total updates manually using dirxadm sob terminate and sob establish operations; see the section "Restoring the Failed Master to the Configuration" in the chapter "Creating a Shadow DSA" for an example.
See Example 3 in the "Monitoring and Recovery Scenarios" section for an example of this recovery procedure.
Recovering from Disabled Shadow Operational Bindings
A Supervisor instance running in supplier mode performs a shadowing operational binding (SOB) check as part of its monitoring operation. When it detects a disabled shadowing agreement on the supplier or the partner consumer, it generates a state log that notifies the administrator about the problem. Note that the Supervisor cannot recover from disabled shadowing agreements; the DirX Directory administrator must take action to solve the problem. See Examples 4 and 5 in the section "Monitoring and Recovery Scenarios" for an example of Supervisor operation to detect and notify about disabled SOBs.
Setting up the Supervisor
To set up floating master configurations for Supervisor monitoring, on each machine that hosts the DirX Directory service:
-
Install the prerequisite software packages
-
Deploy the DirX Directory Supervisor scripts
-
Establish a Supervisor bind DN and a heartbeat-checking test entry
-
Set up an LDAP server for Supervisor monitoring
-
Adjust the DirX Directory abbreviation file for handling Supervisor operation
-
Update the Supervisor setup script
Installing the Prerequisite Software
The DirX Directory Supervisor requires the following software to be installed on each machine in the floating-master configuration:
-
The Perl language/interpreter distribution, version 5.16.3 or newer.
-
The perl-ldap distribution, which is a collection of Perl modules that provides an object-oriented interface to an LDAP server.
See the ReadMe.txt file in the Monitoring installation folder (install_path*/monitoring*) for instructions on how to set up PERL on the supported DirX Directory platforms.
The Supervisor can be configured to send its state logs in email messages to configurable recipients.
If you plan to use this email notification feature on Windows based DirX Directory installations, you need to obtain the freeware email Windows client binary bmail.exe and install it on a Windows machine that is hosting a DirX Directory service instance in the floating-master configuration.
On Linux, the email notification feature uses the built-in mailx client.
Deploying the Supervisor
By default, the DirX Directory Supervisor scripts are located in the DirX Directory installation path install_path*/monitoring/supervisor*. Because the Supervisor script settings must be the same for each floating-master instance, we recommend that you set up one copy of the Supervisor scripts on a shared resource that is accessible to all of the machines that host floating-master instances. Otherwise you will need to maintain separate identical setup scripts on each machine. Note, if there is need for using different LDAP port number on the local and remote floating master for the applications, it is recommended to setup separate LDAP servers with identical LDAP port numbers on both servers for the purpose of monitoring with the supervisor. Finally create the supervisor password file. See “Supervisor Password File” in the DirX Directory Supervisor for details.
Setting up the Supervisor Entries (Supplier Instance Only)
The Supervisor requires an entry to be specified for Supervisor script binds and for heartbeat checking operations. You can use the same entry for both requirements, or you can use two separate entries.
You can create a dedicated Supervisor user entry with any DAP or LDAP client (dirxcp or DirX Directory Manager), or you can use an existing user entry, like the default administrator entry. The user entry selected for Supervisor binds:
-
Must be an ordinary LDAP entry, for example with object class inetOrgPerson.
-
Must be an authorized dirxadm user; as a result, if you create a dedicated Supervisor user entry, you must be sure to add it to the DirX Directory Administrators (DADM) attribute. See the section DirX Directory DSA Operational Attributes in the DirX Directory Syntaxes and Attributes for details.
-
Must be granted by access control to add, read and update its own entry.
As with the Supervisor user entry, you can create a dedicated heartbeat-checking entry with any DAP or LDAP client, or use an existing one. The entry selected for heartbeat checking operations:
-
Must be an ordinary LDAP entry; for example, with object class inetOrgPerson.
-
Must be located in the area of the DIT that is replicated for shadowing.
-
Must have a description attribute.
-
Must be subject to an AccessControl Item that grants add, read and update operations to the Supervisor user.
Note that if you use the Supervisor user entry as the heartbeat-checking entry, it will need to have a description attribute and be located in the replicated part of the DIT.
Setting up the Monitoring LDAP Server (Supplier Instance Only)
The DirX Directory Supervisor scripts require one LDAP server on the supplier instance to be specified for handling heartbeat-checking operations. The selected server must have the following characteristics:
-
It must be a read-write LDAP server (the LROS attribute in the LDAP configuration entry should be FALSE)
-
It must be set up for local searches only (the LSES attribute in the LDAP configuration subentry should have the values PreferChaining=F, ChainingProhibited=T, LocalScope=T)
You can use dirxcp modify commands or DirX Directory Manager (Configuration view -> LDAP configuration subentry -> General tab and Search Service Controls tab) to adjust the LDAP configuration subentry for the LDAP server on the supplier to be used for Supervisor monitoring operations. Remember to restart the modified LDAP server for the new settings to take effect.
See the section "Setting up the LDAP Server" for a discussion of LDAP server operation service controls and how to set them with dirxcp. See the section "Extending the My-Company LDAP Server" for examples of how to update existing LDAP configuration subentries and create additional LDAP servers with dirxcp.
Updating the DirX Directory Abbreviation File
To prepare the DirX Directory abbreviation file for use with the Supervisor, ensure that it contains the NO_STX_SUFFIX keyword at the start of the file. See the section DirX Directory Files in the DirX Directory Administration Reference for details.
Updating the Supervisor Setup Script
The final task is to edit the Supervisor setup script setup_common_data.tcl and supply the required setup parameter values for the Supervisor and the values of any optional parameters you choose to use. Required parameters include:
-
The IP address of a network router in the configuration, or the hostname or IP address of one of the DirX Directory Service instances in the configuration, if there is no router present or if router monitoring is out of monitoring scope.
-
The LDAP port and the LDAP configuration subentry of the selected LDAP server selected to handle heartbeat-checking operations. It is assumed that all LDAP servers to be connected are using this LDAP port.
-
The distinguished name and the password of the selected Supervisor user entry.
-
The language setting of the operating system (controls the language used in net start dirx / net stop dirx log messages).
See the setup_common_data.tcl reference in the DirX Directory Supervisor for a description of the required and optional setup parameters and their syntax.
Setting up an Email Client (Optional
To use the email notification feature with a running Supervisor, be sure to start it with email notification enabled. The Supervisor core script provides an argument for enabling and disabling email notification and for specifying the severity level of monitoring and recovery incidents that will trigger email notification. For example, notification of a dirxadm sob switch is sent whenever email notification is enabled (by specifying a non-zero value), but notification of a DirX Directory service stop is only sent if the highest level of detail is specified (a value of 3). See the dirxsupervisor.tcl reference page in the DirX Directory Supervisor for details.
Setup on Windows
The Supervisor can be set up to use the freeware Windows email client bmail.exe to send state logs to a Windows email recipient. To enable this feature:
-
Install the bmail.exe client on a DirX Directory service instance in the floating-master configuration that is running on a Windows platform.
-
Make bmail.exe available to the Supervisor by copying the executable to the Supervisor’s working directory (by default, install_path*/monitoring/supervisor* or the location on a shared device) or by setting the PATH variable appropriately.
-
Supply the following parameters to the Supervisor setup script:
-
The address of the email recipient
-
The address to use to identify the sender of the email
-
The SMTP gateway to use for sending the state log emails
Starting the Supervisor
The Supervisor must be started on each DirX Directory service in the configuration. To start the Supervisor, use the dirxsupervisor command. We recommend that you start the Supervisor on the master DirX Directory service first, and then start it on the consumer(s).
The Supervisor core script has several control parameters:
-
Whether to allow emergency switch operations in the event of an unresponsive supplier; by default, emergency switches are disabled.
-
Whether to recover from any outage problem at all. This running mode only monitors the responsiveness of DirX Directory services and is helpful for testing the setup parameters in advance (simulation mode).
-
Whether to send state logs in email messages to a Windows email client; by default, email notification is disabled. Enable it only if you have set up a Windows email client, as described in "Setting up a Windows Email Client".
-
Whether to display detailed progress information during script operation; by default, detailed reporting is disabled. Enable it only if you are customizing the Supervisor scripts and need the details for debugging purposes. It should be disabled when running the Supervisor in production environments.
See the dirxsupervisor reference in the DirX Directory Supervisor for a detailed syntax description.
Stopping the Supervisor
Once started via dirxsupervisor, the Supervisor runs continuously. To shut it down, use CTRL/C.
You may need to take the supplier in a floating-master configuration offline for maintenance. In this case, make sure you shut down the Supervisor running on this machine before you shut down the running DirX Directory service.
Changing the Monitored Consumer DSA
On startup, the script selects a consumer DSA to monitor based on its position in the cooperating DSA table. It identifies this DSA in its startup output. For example:
Processing <0: TS=DSA1,NA=TCP/IP_IDM!internet=1.2.3.4+port=2,DNS=(HOST=ConsumerDB,SSLPORT=21201,PLAINPORT=21200)>
        /CN=DirX-DSA-ConsumerDB
        CN=DIRX-DSA-ConsumerDB
        TS=DSA1
        Hostname=ConsumerDB
Monitoring and Recovery Scenarios
This section provides some examples of problems that can occur in a floating-master configuration, the monitoring and recovery operations performed by supplier and consumer Supervisors and the state logging that accompanies their execution on supplier and consumer sides. For a detailed description of Supervisor state log syntax, see the DirX Directory Supervisor.
The following Supervisor state logs show the monitoring and recovery operations that occur when the DirX Directory service has stopped on a floating-master instance. This example shows the Supervisor successfully starting the respective DirX Directory service after several connection timeouts occur.
The following state log shows the detection of the problem during a heartbeat checking operation:
13.Dec.2013_16:37:11: POK 1.Heartbeat - general bind/modify problem identified to supplier=tmp1-w2k8-r1 (1)
The next group of messages indicates the attempts to contact the DirX Directory service:
13.Dec.2013_16:37:36: POK 1.(getSUK) Local-AE-Show-1 failed with:
                        Error: Directory Server not available.
13.Dec.2013_16:37:47: POK 2.(getSUK) Local-AE-Show-1 failed with:
                        Error: Directory Server not available.
13.Dec.2013_16:37:58: POK 3.(getSUK) Local-AE-Show-1 failed with:
                        Error: Directory Server not available.
13.Dec.2013_16:38:09: NOK (getSUK) Local-AE-Show-1 failed 3 times with:
                        Error: Directory Server not available.
The next state log shows the notification that the Supervisor gives that it will attempt to restart the DirX Directory service:
13.Dec.2013_16:38:09: NOK local DSA unresponsive - Restarting DirX will get invoked now (120)
The final state log in this series indicates that the restart was successful.
13.Dec.2013_16:38:36: OK (DirXrestart) 1.DirX-Start and LDAP connectivity passed
The following Supervisor state logs show the monitoring and recovery operations that occur when the Supervisor is unable to restart the DirX Directory service on the supplier instance. In this case, the Supervisor on the supplier invokes an emergency switch to the monitored consumer after several LDAP binds and DirX Directory service restarts are refused.
Supplier Log
This part of the example shows the state logs from the Supervisor running on the supplier. The logs below identify the problem and the follow-up test operations:
13.Dec.2013_16:49:18: POK 2.Heartbeat - general bind/modify problem identified to supplier=tmp1-w2k8-r1 (1)
13.Dec.2013_16:49:54: POK 1.(getSUK) Local-AE-Show-1 failed with:
                        Error: Directory Server not available.
13.Dec.2013_16:50:05: POK 2.(getSUK) Local-AE-Show-1 failed with:
                        Error: Directory Server not available.
13.Dec.2013_16:50:16: POK 3.(getSUK) Local-AE-Show-1 failed with:
                        Error: Directory Server not available.
13.Dec.2013_16:50:27: NOK (getSUK) Local-AE-Show-1 failed 3 times with:
                        Error: Directory Server not available.
The next state log shows the notification that the Supervisor will try to restart the DirX Directory service:
13.Dec.2013_16:50:27: NOK local DSA unresponsive - Restarting DirX will get invoked now (120)
The next group of state logs shows the failed attempts to restart the service and the notification about the failures:
13.Dec.2013_16:50:39: POK (DirXrestart) 1.DirX-Start failed
13.Dec.2013_16:50:51: POK (DirXrestart) 2.DirX-Start failed
13.Dec.2013_16:51:33: POK (DirXrestart) 3.DirX-Start failed
13.Dec.2013_16:51:43: NOK (DirXrestart) The DirX services refuse to startup 4 times
The next state log shows the emergency switch to the consumer:
13.Dec.2013_16:51:45: OK (emergency_switch): Emergency switch to TMP1-W2K8-R3 passed (EN=0)
The final state log in the series indicates that the Supervisor will now shut down, since there is no longer a running DirX Directory service to be monitored:
13.Dec.2013_16:51:43: OK Exit this script, as there is no local DSA instance to be validated anymore
Consumer Log
This part of the example shows the state logs from the Supervisor running on the consumer.
The following group of state logs shows the Supervisor detecting the consumer role and successful heartbeat operations to the consumer and supplier:
13.Dec.2013_16:48:57: MSG 1.(rolesCHeckNAME) InstanceRole detected: Shadow
13.Dec.2013_16:49:01:  OK 1.Heartbeat search on consumer=TMP1-W2K8-R3 PASSED (0)
13.Dec.2013_16:49:09:  OK 1.Heartbeat search on remote supplier=tmp1-w2k8-r1 PASSED (0)
The next group of state logs shows the heartbeat operation passing on the consumer and the connection to the remote supplier failing several times:
13.Dec.2013_16:49:19: MSG 1.(rolesCHeckNAME) InstanceRole detected: Shadow
13.Dec.2013_16:49:23:  OK 1.Heartbeat search on consumer=TMP1-W2K8-R3 PASSED (0)
13.Dec.2013_16:49:31: POK 1.Heartbeat connecting to remote supplier=tmp1-w2k8-r1 failed (1)
13.Dec.2013_16:49:47: POK 1.Heartbeat connecting to remote supplier=tmp1-w2k8-r1 failed (1)
13.Dec.2013_16:50:02: POK 1.Heartbeat connecting to remote supplier=tmp1-w2k8-r1 failed (1)
The next state log shows the notification about the LDAP connection problem to the supplier:
13.Dec.2013_16:50:12: NOK General ldap connection problem identified to supplier-DSA (tmp1-w2k8-r1) 3 times
The next state log shows that the consumer Supervisor can successfully ping the router in the configuration even though the LDAP connection request to the supplier is continuously refused:
13.Dec.2013_16:50:12: OK ping to router (192.168.88.130) passed (CHECK-NO: 1) while ldap connection to tmp1-w2k8-r1 failed
The next sequence of state logs shows the consumer Supervisor repeating the same heartbeat operations as shown above, and encountering the same LDAP connection failure:
13.Dec.2013_16:50:34: MSG 2.(rolesCHeckNAME) InstanceRole detected: Shadow
13.Dec.2013_16:50:38:  OK 1.Heartbeat search on consumer=TMP1-W2K8-R3 PASSED (0)
13.Dec.2013_16:50:46: POK 1.Heartbeat connecting to remote supplier=tmp1-w2k8-r1 failed (1)
13.Dec.2013_16:51:02: POK 1.Heartbeat connecting to remote supplier=tmp1-w2k8-r1 failed (1)
13.Dec.2013_16:51:17: POK 1.Heartbeat connecting to remote supplier=tmp1-w2k8-r1 failed (1)
13.Dec.2013_16:51:27: NOK General ldap connection problem identified to supplier-DSA (tmp1-w2k8-r1) 3 times
13.Dec.2013_16:51:27:  OK ping to router (192.168.88.130) passed (CHECK-NO: 2) while ldap connection to tmp1-w2k8-r1 failed
The final state log in the series shows the Supervisor detecting that it is now running on the switched supplier:
13.Dec.2013_16:51:49: OK (rolesCheckNAME) SOB-Switch detected: new Supplier=CN=DIRX-DSA-TMP1-W2K8-R3 (EN=0)
The following Supervisor state logs show the monitoring and recovery operations that occur when restarting the DirX Directory service on the supplier fails continuously because of ongoing network connection outages. This example shows the Supervisor on the consumer invoking an emergency switch to itself after several LDAP binds and DirX Directory restarts are refused.
In this situation, the process is as follows:
-
The supplier that is unreachable because of the network outage will go on operating locally while its Supervisor periodically reports replication problems to the partner consumer.
-
The Supervisor on the consumer also periodically reports a connection problem to the supplier. After several such incidents, the consumer performs an emergency switch to its own service.
-
Now there are two shadow masters operating without any interconnection because of the network outage.
-
When the network outage is resolved and both shadow suppliers can interoperate again, the old supplier is automatically restarted as the consumer.
Supplier Log
The first group of state logs shows successful heartbeat checking between supplier R1 and consumer R3:
13.Dec.2013_17:06:48:  OK 1.Heartbeat operation PASSED to supplier=tmp1-w2k8-r1 (DSC=1386950804)
13.Dec.2013_17:06:53:  OK 1.Heartbeat compare on consumer=TMP1-W2K8-R3 PASSED (0)
The next set of state logs shows the problem connecting to consumer R3:
13.Dec.2013_17:07:06: POK 1.(getSUK) Remote-AE-Show-1 (TMP1-W2K8-R3) failed with:
                        Error: Directory Server not available.
13.Dec.2013_17:07:16: POK 2.(getSUK) Remote-AE-Show-1 (TMP1-W2K8-R3) failed with:
                        Error: Directory Server not available.
13.Dec.2013_17:07:26: POK 3.(getSUK) Remote-AE-Show-1 (TMP1-W2K8-R3) failed with:
                        Error: Directory Server not available.
13.Dec.2013_17:07:36: NOK (getSUK) Remote-AE-Show-1 (TMP1-W2K8-R3) failed 3 times with:
                        Error: Directory Server not available.
The next set of state logs shows the effect of the network outage: R1 continues to identify itself as the supplier, and remote heartbeat operations to R3 continue to fail:
13.Dec.2013_17:07:36: MSG (rolesCheckNAME) InstanceRole detected: Master (on tmp1-w2k8-r1)
        supplierHost:   tmp1-w2k8-r1    CN=DIRX-DSA-TMP1-W2K8-R1        /CN=DIRX-DSA-TMP1-W2K8-R1
        consumerHost:   TMP1-W2K8-R3    CN=DIRX-DSA-TMP1-W2K8-R3        /CN=DIRX-DSA-TMP1-W2K8-R3
13.Dec.2013_17:07:36: MSG IncidentCount=3, lastIncidentTime=13.Dec.2013_17:07:26
13.Dec.2013_17:07:56:  OK 1.Heartbeat operation PASSED to supplier=tmp1-w2k8-r1 (DSC=1386950866)
13.Dec.2013_17:08:00: POK 1.Heartbeat connecting to consumer=TMP1-W2K8-R3 failed (1)
The next series of state logs shows that there is no connection established to the partner R3 as long as the network outage is in effect:
13.Dec.2013_17:14:16: MSG Operational binding state on remote consumer: TMP1-W2K8-R3 (EN=0)
                        Error: Directory Server not available.
13.Dec.2013_17:14:16: NOK replication problem detected in one of the SOBs - administrative attention/intervention recommended
13.Dec.2013_17:14:16: POK 1.(getSUK) Remote-AE-Show-1 (TMP1-W2K8-R3) failed with:
                        Error: Directory Server not available.
13.Dec.2013_17:14:26: POK 2.(getSUK) Remote-AE-Show-1 (TMP1-W2K8-R3) failed with:
                        Error: Directory Server not available.
13.Dec.2013_17:14:36: POK 3.(getSUK) Remote-AE-Show-1 (TMP1-W2K8-R3) failed with:
                        Error: Directory Server not available.
13.Dec.2013_17:14:46: NOK (getSUK) Remote-AE-Show-1 (TMP1-W2K8-R3) failed 3 times with:
                        Error: Directory Server not available.
The next series of state logs shows what happens when the network is back online: the Supervisor detects two supplier DSAs in the configuration, and then implements the recovery operation for switching its local DSA R1 back to a consumer:
13.Dec.2013_17:16:29: MSG (rolesCheckNAME) Two Suppliers-Check: (SUK (tmp1-w2k8-r1): /CN=DIRX-DSA-TMP1-W2K8-R1)
                                                                (SUK (TMP1-W2K8-R3): /CN=DIRX-DSA-TMP1-W2K8-R3)
13.Dec.2013_17:16:29: NOK (rolesCheckNAME) Two Suppliers: (/CN=DIRX-DSA-TMP1-W2K8-R1) vs. (/CN=DIRX-DSA-TMP1-W2K8-R3) -> Administrative attention required
13.Dec.2013_17:16:29: MSG (rolesCheckNAME) CDSA-MT of local  supplier: (/CN=DIRX-DSA-TMP1-W2K8-R1,tmp1-w2k8-r1)=20131213155635.512Z
13.Dec.2013_17:16:29: MSG                 CDSA-MT of remote supplier: (/CN=DIRX-DSA-TMP1-W2K8-R3,TMP1-W2K8-R3)=20131213161437.419Z
13.Dec.2013_17:16:29: MSG  ##### Remote supplier (TMP1-W2K8-R3) keeps the most recent CDSA thus stop local supplier (tmp1-w2k8-r1)
13.Dec.2013_17:16:29: MSG  ##### Manually invoke TOTAL_UPDATE on remote supplier (TMP1-W2K8-R3), local DirX-supplier will be rest
arted
13.Dec.2013_17:16:29: NOK local DSA unresponsive - Restarting DirX will get invoked now (400)
13.Dec.2013_17:16:52:  OK (DirXrestart) 1.DirX-Stop passed
13.Dec.2013_17:17:28:  OK (DirXrestart) 1.DirX-Start and LDAP connectivity passed
13.Dec.2013_17:17:52:  OK 1.Heartbeat operation PASSED to supplier=tmp1-w2k8-r1 (DSC=1386951468)
13.Dec.2013_17:17:57:  OK 1.Heartbeat compare on consumer=TMP1-W2K8-R3 PASSED (0)
13.Dec.2013_17:18:20: MSG 1.(rolesCHeckNAME) InstanceRole detected: Shadow
13.Dec.2013_17:18:25:  OK 1.Heartbeat search on consumer=tmp1-w2k8-r1 PASSED (0)
13.Dec.2013_17:18:32:  OK 1.Heartbeat search on remote supplier=TMP1-W2K8-R3 PASSED (0)
Consumer Log
The first group of state logs shows successful heartbeat checking between supplier R1 and consumer R3:
13.Dec.2013_17:06:41: MSG 1.(rolesCHeckNAME) InstanceRole detected: Shadow
13.Dec.2013_17:06:46:  OK 1.Heartbeat search on consumer=TMP1-W2K8-R3 PASSED (0)
13.Dec.2013_17:06:53:  OK 1.Heartbeat search on remote supplier=tmp1-w2k8-r1 PASSED (0)
The next set of state logs shows the heartbeat operations failing to the supplier R1:
13.Dec.2013_17:07:03: MSG 1.(rolesCHeckNAME) InstanceRole detected: Shadow
13.Dec.2013_17:07:08:  OK 1.Heartbeat search on consumer=TMP1-W2K8-R3 PASSED (0)
13.Dec.2013_17:07:33: POK 1.Heartbeat connecting to remote supplier=tmp1-w2k8-r1 failed (1)
13.Dec.2013_17:07:56: POK 1.Heartbeat connecting to remote supplier=tmp1-w2k8-r1 failed (1)
13.Dec.2013_17:08:19: POK 1.Heartbeat connecting to remote supplier=tmp1-w2k8-r1 failed (1)
13.Dec.2013_17:08:29: NOK General ldap connection problem identified to supplier-DSA (tmp1-w2k8-r1) 3 times
This state log shows that a ping to the router attached to R1 was successful, but the LDAP connection to R1 was refused:
13.Dec.2013_17:08:29: OK ping to router (192.168.88.130) passed (CHECK-NO: 1) while ldap connection to tmp1-w2k8-r1 failed
The next set of state logs shows the Supervisor continuing to perform heartbeat operations to the supplier R1, which all fail, and then performing a ping operation to the router, which succeeds:
13.Dec.2013_17:08:52: MSG 2.(rolesCHeckNAME) InstanceRole detected: Shadow
13.Dec.2013_17:08:57:  OK 1.Heartbeat search on consumer=TMP1-W2K8-R3 PASSED (0)
13.Dec.2013_17:09:25: POK 1.Heartbeat connecting to remote supplier=tmp1-w2k8-r1 failed (1)
13.Dec.2013_17:09:48: POK 1.Heartbeat connecting to remote supplier=tmp1-w2k8-r1 failed (1)
13.Dec.2013_17:10:11: POK 1.Heartbeat connecting to remote supplier=tmp1-w2k8-r1 failed (1)
13.Dec.2013_17:10:21: NOK General ldap connection problem identified to supplier-DSA (tmp1-w2k8-r1) 3 times
13.Dec.2013_17:10:21:  OK ping to router (192.168.88.130) passed (CHECK-NO: 2) while ldap connection to tmp1-w2k8-r1 failed
13.Dec.2013_17:10:43: MSG 3.(rolesCHeckNAME) InstanceRole detected: Shadow
13.Dec.2013_17:10:47:  OK 1.Heartbeat search on consumer=TMP1-W2K8-R3 PASSED (0)
13.Dec.2013_17:11:13: POK 1.Heartbeat connecting to remote supplier=tmp1-w2k8-r1 failed (1)
13.Dec.2013_17:11:36: POK 1.Heartbeat connecting to remote supplier=tmp1-w2k8-r1 failed (1)
13.Dec.2013_17:12:00: POK 1.Heartbeat connecting to remote supplier=tmp1-w2k8-r1 failed (1)
13.Dec.2013_17:12:10: NOK General ldap connection problem identified to supplier-DSA (tmp1-w2k8-r1) 3 times
13.Dec.2013_17:12:10:  OK ping to router (192.168.88.130) passed (CHECK-NO: 3) while ldap connection to tmp1-w2k8-r1 failed
The next set of state logs shows the Supervisor exhausting its maximum operation retry and performing an emergency switch to itself (shown in bold type):
13.Dec.2013_17:12:31: MSG 4.(rolesCHeckNAME) InstanceRole detected: Shadow
13.Dec.2013_17:12:36:  OK 1.Heartbeat search on consumer=TMP1-W2K8-R3 PASSED (0)
13.Dec.2013_17:13:01: POK 1.Heartbeat connecting to remote supplier=tmp1-w2k8-r1 failed (1)
13.Dec.2013_17:13:30: POK 1.Heartbeat connecting to remote supplier=tmp1-w2k8-r1 failed (1)
13.Dec.2013_17:13:53: POK 1.Heartbeat connecting to remote supplier=tmp1-w2k8-r1 failed (1)
13.Dec.2013_17:14:03: NOK General ldap connection problem identified to supplier-DSA (tmp1-w2k8-r1) 3 times
13.Dec.2013_17:14:03:  OK ping to router (192.168.88.130) passed (CHECK-NO: 4) while ldap connection to tmp1-w2k8-r1 failed
13.Dec.2013_17:14:47:  OK (emergency_switch): Emergency switch to localhost passed (EN=0)
The final series of state logs shows consumer R3 now operating as the supplier, with old supplier R1 operating as the consumer:
13.Dec.2013_17:19:35:  OK 1.Heartbeat operation PASSED to supplier=TMP1-W2K8-R3 (DSC=1386951571)
13.Dec.2013_17:19:39:  OK 1.Heartbeat compare on consumer=tmp1-w2k8-r1 PASSED (0)
13.Dec.2013_17:19:53: MSG (rolesCheckNAME) InstanceRole detected: Master (on TMP1-W2K8-R3)
        supplierHost:   TMP1-W2K8-R3    CN=DIRX-DSA-TMP1-W2K8-R3        /CN=DIRX-DSA-TMP1-W2K8-R3
        consumerHost:   tmp1-w2k8-r1    CN=DIRX-DSA-TMP1-W2K8-R1        /CN=DIRX-DSA-TMP1-W2K8-R1
13.Dec.2013_17:19:53: MSG IncidentCount=7, lastIncidentTime=13.Dec.2013_17:16:21
13.Dec.2013_17:20:07:  OK 1.Heartbeat operation PASSED to supplier=TMP1-W2K8-R3 (DSC=1386951603)
13.Dec.2013_17:20:11:  OK 1.Heartbeat compare on consumer=tmp1-w2k8-r1 PASSED (0)
The following state logs show the monitoring operations and notifications that occur when the shadow operational binding (SOB) is disabled on the supplier. The example shows the supplier-side Supervisor generating notifications about the problem in state logging messages. The consumer-side Supervisor does not log any notifications about the problem because it does not compare heartbeat values when operating in consumer mode.
In this case, the DirX Directory administrator must take action to recover from the problem.
Supplier Log
This set of state logs shows the Supervisor checking the shadowing agreement on the supplier DSA and determining that it is disabled (D=TRUE in US) and generating a state log that indicates the problem (shown in bold type):
sob show -supp /CN=DirX-DSA-tmp1-w2k8-r1 -cons /CN=DirX-DSA-tmp1-w2k8-r3 -agr 88
OBS=COOPERATIVE OBMV={VF=131213134341Z} AGR={SS={AREA={CP={/},RA={DEF=TRUE}},ATT={DEF=TRUE},KNO={KT=BOTH,EK=TRUE}}} US={D=TRUE,NU=19700101000000Z,US={SUS={AC=CHANGED,OU={SID=0,UT=20131214203753Z,OPMSN=633,AC=FALSE},AU={WS=INVOKED}}}} RPOL={INI={RMR=5,RTO=600,RI=120,ATU=TRUE},CONS={REPLS=TRUE}}
local_dsaname: /CN=DirX-DSA-tmp1-w2k8-r1
con: /CN=DirX-DSA-tmp1-w2k8-r3
--> SOB=88: D=TRUE (disabled)
This set of state logs shows the Supervisor checking the state of the shadowing agreement on the consumer, which shows it is enabled (D=FALSE in US) and generating a state log (shown in bold type) that notifies the administrator about the problem:
14.Dec.2013_21:39:01: MSG Operational binding state on remote consumer: TMP1-W2K8-R3 (EN=0)
                        sob show -supp /CN=DirX-DSA-tmp1-w2k8-r1 -cons /CN=DirX-DSA-tmp1-w2k8-r3 -agr 88
OBS=COOPERATIVE OBMV={VF=131213134341Z} AGR={SS={AREA={CP={/},RA={DEF=TRUE}},ATT={DEF=TRUE},KNO={KT=BOTH,EK=TRUE}}} US={D=FALSE,NU=19700101000000Z,US={CUS={LU=20131214203753Z,CUS=INCREMENTAL-UPDATE}}} RPOL={INI={RMR=5,RTO=600,RI=120,ATU=TRUE},CONS={REPLS=TRUE}}
/CN=DirX-DSA-tmp1-w2k8-r1 /CN=DirX-DSA-tmp1-w2k8-r3
14.Dec.2013_21:39:01: NOK replication problem detected in one of the SOBs - administrative attention/intervention recommended
Consumer Log
The consumer-side Supervisor does not generate any state logs about the problem because, in consumer-mode operation, it does not run the monitoring operation that detects the problem.
The following state logs show the monitoring operations and notifications that occur when the shadow operational binding (SOB) is disabled on the consumer. The example shows the supplier-side and consumer-side Supervisor generating notifications about the problem in state logging messages.
In this case, the DirX Directory administrator must take action to recover from the problem.
Supplier Log
This set of state logs shows the Supervisor checking the shadowing agreement on the supplier DSA and detecting the disabled agreement on the consumer (shown in bold type):
sob show -supp /CN=DirX-DSA-tmp1-w2k8-r1 -cons /CN=DirX-DSA-tmp1-w2k8-r3 -agr 88
OBS=COOPERATIVE OBMV={VF=131213134341Z} AGR={SS={AREA={CP={/},RA={DEF=TRUE}},ATT={DEF=TRUE},KNO={KT=BOTH,EK=TRUE}}} US={D=FALSE,NU=20131214205016Z,US={SUS={AC=TOUCHED,OU={SID=0,UT=20131214204743Z,OPMSN=636,AC=TRUE},FU={SID=0,UT=20131214204815Z,AC=FALSE,OS=0,MC=1,FR=4002:INACTIVE_AGREEMENT},AU={WS=INVOKED}}}} RPOL={INI={RMR=5,RTO=600,RI=120,ATU=TRUE},CONS={REPLS=TRUE}}
local_dsaname: /CN=DirX-DSA-tmp1-w2k8-r1
con: /CN=DirX-DSA-tmp1-w2k8-r3
--> SOB=88: FU= (Fault reason)
This set of state logs shows the Supervisor checking the state of the shadowing agreement, which shows it is disabled (D=TRUE in US) and generating a state log (shown in bold type) that notifies the administrator about the problem:
14.Dec.2013_21:48:43: MSG Operational binding state on remote consumer: TMP1-W2K8-R3 (EN=0)
                        sob show -supp /CN=DirX-DSA-tmp1-w2k8-r1 -cons /CN=DirX-DSA-tmp1-w2k8-r3 -agr 88OBS=COOPERATIVE OBMV={VF=131213134341Z} AGR={SS={AREA={CP={/},RA={DEF=TRUE}},ATT={DEF=TRUE},KNO={KT=BOTH,EK=TRUE}}} US={D=TRUE,NU=19700101000000Z,US={CUS={LU=20131214204743Z,CUS=INCREMENTAL-UPDATE}}} RPOL={INI={RMR=5,RTO=600,RI=120,ATU=TRUE},CONS={REPLS=TRUE}}
--> SOB=88: D=TRUE (disabled)
/CN=DirX-DSA-tmp1-w2k8-r1 /CN=DirX-DSA-tmp1-w2k8-r3
14.Dec.2013_21:48:43: NOK replication problem detected in one of the SOBs - administrative attention/intervention recommended
Consumer Log
This set of state logs shows the Supervisor indicating the disabled shadowing agreement on the consumer (shown in bold type) and notifying the administrator about the problem (shown in bold type):
sob show -supp /CN=DirX-DSA-tmp1-w2k8-r1 -cons /CN=DirX-DSA-tmp1-w2k8-r3 -agr 88
OBS=COOPERATIVE OBMV={VF=131213134341Z} AGR={SS={AREA={CP={/},RA={DEF=TRUE}},ATT={DEF=TRUE},KNO={KT=BOTH,EK=TRUE}}} US={D=TRUE,NU=19700101000000Z,US={CUS={LU=20131214204743Z,CUS=INCREMENTAL-UPDATE}}} RPOL={INI={RMR=5,RTO=600,RI=120,ATU=TRUE},CONS={REPLS=TRUE}}
--> SOB=88: D=TRUE (disabled) CINS=FALSE
/CN=DirX-DSA-tmp1-w2k8-r1 /CN=DirX-DSA-tmp1-w2k8-r3
14.Dec.2013_21:48:38: NOK replication problem detected in one of the SOBs - administrative intervention recommended (xEN=0)
This example illustrates the monitor and recovery operations on a dirxadm sob switch to the consumer. In this case, the Supervisor on both supplier and consumer log the incident.
Supplier Log
This set of state logs shows the Supervisor performing heartbeat checking operations in supplier-mode:
14.Dec.2013_22:00:56:  OK 1.Heartbeat operation PASSED to supplier=tmp1-w2k8-r1 (DSC=1387054852)
14.Dec.2013_22:01:01:  OK 1.Heartbeat compare on consumer=TMP1-W2K8-R3 PASSED (0)
The next set of state logs shows the Supervisor detecting the DSA role change to consumer:
14.Dec.2013_22:01:14: MSG (rolesChecKNAME) InstanceRole detected: Shadow
14.Dec.2013_22:01:14: MSG Continue proofing ownRole change on shadow/consumer-side
After issuing this state log, the Supervisor changes to consumer-mode operation.
Consumer Log
This set of state logs shows the Supervisor performing heartbeat-checking operations in consumer-mode:
14.Dec.2013_22:00:50: MSG 1.(rolesCHeckNAME) InstanceRole detected: Shadow
14.Dec.2013_22:00:54:  OK 1.Heartbeat search on consumer=TMP1-W2K8-R3 PASSED (0)
14.Dec.2013_22:01:02:  OK 1.Heartbeat search on remote supplier=tmp1-w2k8-r1 PASSED (0)
The next set of state logs shows the Supervisor detecting the DSA role change to supplier:
14.Dec.2013_22:01:12: OK  (rolesCheckNAME) SOB-Switch detected: new Supplier=CN=DIRX-DSA-TMP1-W2K8-R3 (EN=0)
14.Dec.2013_22:01:12: MSG IncidentCount=1, lastIncidentTime=14.Dec.2013_22:01:12
After issuing this state log, the Supervisor changes to supplier-mode operation.
Consumer Log on Remaining Consumer
This set of state logs shows the Supervisor running on another consumer performing heartbeat-checking operations in consumer-mode:
14.Dec.2013_22:00:58: MSG 1.(rolesCHeckNAME) InstanceRole detected: Shadow
14.Dec.2013_22:01:03:  OK 1.Heartbeat search on consumer=TMP1-W2K8-R2 PASSED (0)
14.Dec.2013_22:01:10:  OK 1.Heartbeat search on remote supplier=tmp1-w2k8-r1 PASSED (0)
The next set of messages shows this Supervisor detecting the supplier change during heartbeat checking operations:
14.Dec.2013_22:01:20: MSG 1.(rolesCHeckNAME) InstanceRole detected: Shadow
14.Dec.2013_22:01:25:  OK 1.Heartbeat search on consumer=TMP1-W2K8-R2 PASSED (0)
14.Dec.2013_22:01:33:  OK 1.Heartbeat search on remote supplier=TMP1-W2K8-R3 PASSED (0)
This example shows supplier-side Supervisor and consumer-side Supervisor state logging when no incidents are detected.The example shows that both Supervisors generate periodic state logging about heartbeat operation results.
Supplier Log
The following series of state logs shows the heartbeat operations performed by the Supervisor on the local supplier and remote consumer.The messages highlighted in bold indicate success.
14.Dec.2013_22:05:47: MSG (rolesCheckNAME) InstanceRole detected: Master (on tmp1-w2k8-r1)
        supplierHost:   tmp1-w2k8-r1    CN=DIRX-DSA-TMP1-W2K8-R1        /CN=DIRX-DSA-TMP1-W2K8-R1
        consumerHost:   TMP1-W2K8-R3    CN=DIRX-DSA-TMP1-W2K8-R3        /CN=DIRX-DSA-TMP1-W2K8-R3
14.Dec.2013_22:05:47: MSG IncidentCount=0, lastIncidentTime=--:--:--
14.Dec.2013_22:06:01:  OK 1.Heartbeat operation PASSED to supplier=tmp1-w2k8-r1 (DSC=1387055157)
14.Dec.2013_22:06:06:  OK 1.Heartbeat compare on consumer=TMP1-W2K8-R3 PASSED (0)
14.Dec.2013_22:06:19: MSG (rolesCheckNAME) InstanceRole detected: Master (on tmp1-w2k8-r1)
        supplierHost:   tmp1-w2k8-r1    CN=DIRX-DSA-TMP1-W2K8-R1        /CN=DIRX-DSA-TMP1-W2K8-R1
        consumerHost:   TMP1-W2K8-R3    CN=DIRX-DSA-TMP1-W2K8-R3        /CN=DIRX-DSA-TMP1-W2K8-R3
14.Dec.2013_22:06:19: MSG IncidentCount=0, lastIncidentTime=--:--:--
14.Dec.2013_22:06:33:  OK 1.Heartbeat operation PASSED to supplier=tmp1-w2k8-r1 (DSC=1387055189)
14.Dec.2013_22:06:38:  OK 1.Heartbeat compare on consumer=TMP1-W2K8-R3 PASSED (0)
14.Dec.2013_22:06:51: MSG (rolesCheckNAME) InstanceRole detected: Master (on tmp1-w2k8-r1)
        supplierHost:   tmp1-w2k8-r1    CN=DIRX-DSA-TMP1-W2K8-R1        /CN=DIRX-DSA-TMP1-W2K8-R1
        consumerHost:   TMP1-W2K8-R3    CN=DIRX-DSA-TMP1-W2K8-R3        /CN=DIRX-DSA-TMP1-W2K8-R3
14.Dec.2013_22:06:51: MSG IncidentCount=0, lastIncidentTime=--:--:--
14.Dec.2013_22:07:05:  OK 1.Heartbeat operation PASSED to supplier=tmp1-w2k8-r1 (DSC=1387055221)
14.Dec.2013_22:07:10:  OK 1.Heartbeat compare on consumer=TMP1-W2K8-R3 PASSED (0)
Consumer Log
The following group of state logs shows the heartbeat checking operations performed by the consumer Supervisor on the local consumer and remote supplier.The messages highlighted in bold type indicate success.
14.Dec.2013_22:05:38: MSG 1.(rolesCHeckNAME) InstanceRole detected: Shadow
14.Dec.2013_22:05:43:  OK 1.Heartbeat search on consumer=TMP1-W2K8-R2 PASSED (0)
14.Dec.2013_22:05:50:  OK 1.Heartbeat search on remote supplier=tmp1-w2k8-r1 PASSED (0)

14.Dec.2013_22:06:00: MSG 1.(rolesCHeckNAME) InstanceRole detected: Shadow
14.Dec.2013_22:06:05:  OK 1.Heartbeat search on consumer=TMP1-W2K8-R2 PASSED (0)
14.Dec.2013_22:06:12:  OK 1.Heartbeat search on remote supplier=tmp1-w2k8-r1 PASSED (0)

14.Dec.2013_22:06:22: MSG 1.(rolesCHeckNAME) InstanceRole detected: Shadow
14.Dec.2013_22:06:26:  OK 1.Heartbeat search on consumer=TMP1-W2K8-R2 PASSED (0)
14.Dec.2013_22:06:34:  OK 1.Heartbeat search on remote supplier=tmp1-w2k8-r1 PASSED (0)
Using DSA Auditing
Auditing is another way to observe the DSA, but for billing and accounting management rather than for processing management.When auditing is enabled, the DirX Directory auditing service writes information about the DSA operations that occur into a binary audit log file.Each logged DSA operation is stored as one record in the audit log file.Information recorded about the operation includes:
-
The session ID, which is used to distinguish between different connections
-
The time the operation started, and the time it ended
-
The duration of the operation
-
The protocol used for the operation (DAP, DSP, DISP, or local)
-
The type of operation performed; for example, a bind, a search, or a remove
-
Operation-specific information, such as the IP address of the initiator and the authentication method used, if the operation was a bind, or the target object if the operation was a remove, or the target object, filter information, and other search operation specific information if the operation was a search
-
The result of the operation (success, or failure with error code information, and for search results the size of the result pdu)
Auditing is most often used when a company offers its DirX Directory service to third party customers. The DirX Directory administrators for the company use the DirX Directory auditing tools to track the DSA operations initiated by the third party customers; the company that owns the DirX Directory services can then bill these customers for the number of DSA operations they make and the length of time the operations run.
The tools for managing DirX Directory auditing are:
-
The dirxadm audit object and its operations, which is used to enable, configure, and manage the auditing of DSA operations
-
The dirxauddecode program, which is used to convert the binary format audit log file generated by DirX Directory auditing into a human-readable or program-readable format.
-
The dirxaudstatistics program, which is used to evaluate multiple binary audit log files.
-
The LDAP extended operations dsa_audit_evaluate, dsa_audit_enable, dsa_audit_disable, dsa_audit_info for managing DSA auditing available through the dirxextop command (see the dirxextop section in the DirX Directory Administration Reference for details)
-
DirX Directory Manager’s Monitor view (see the DirX Directory Manager Guide for details)
The next sections describe the tasks associated with auditing and how you perform them with the DirX Directory auditing tool dirxadm audit.
Enabling and Disabling Audit Logging
Auditing is disabled by default. To enable auditing, use the dirxadm command:
audit modify -status on
This command enables auditing immediately. Alternatively, you can use the LDAP extended operation dsa_audit_enable to enable auditing.
To disable auditing, use the dirxadm command:
audit modify -status off
Alternatively, you can use the LDAP extended operation dsa_audit_disable to disable auditing.
Selecting the Level of Auditing
Once it is enabled, the DirX Directory auditing service, by default, writes a record of every operation the DSA performs to the audit log file. You can restrict audit logging to certain categories of DSA operations by using the dirxadm command:
audit modify -level level
where level is one or more of the following keywords:
- ENTRY
-
Use the ENTRY keyword to audit only those DSA operations that affect entries.
- ATTR
-
Use the ATTR keyword to audit only those DSA operations that affect attributes.
- ATTRVAL
-
Use the ATTRVAL keyword to audit only those DSA operations that affect attributes and values.
Using the -level option to log only certain types of transactions can help you to minimize the size of the audit log file.
Managing the Audit Log File
Managing the audit log file consists of three tasks:
-
Establishing the audit log file’s size
-
Choosing how to handle audit log file overflow
-
Saving the data in the audit log file
Establishing the Size of the Audit Log File
By default, the audit log file will store a maximum of 50000 records of audit data. You can change this maximum size with the dirxadm command
audit modify -size size
where size is an integer that specifies the maximum amount of data in bytes you want the audit log file to store. Use 0 to specify an unlimited maximum size. If you select an unlimited size for the audit log file, be sure to keep track of the audit log file’s size and empty it periodically.
Handling Audit Log File Overflow
Administrators can choose one of three different strategies for handling a full audit log file. To set the strategy, use the dirxadm command:
audit modify -overflow strategy
where strategy is one of the keywords:
- STOP
-
Use the STOP keyword to direct DirX Directory auditing to stop automatically when the audit log file is full.
- STOP-DSA
-
Use the STOP-DSA keyword to direct the DSA to shut down automatically when the audit log file is full.
- WRAP
-
Use the WRAP keyword to direct the DirX Directory auditing service to write overflow data to the top of the audit log file, overwriting any existing data there, when the audit log file is full.
- MOVE
-
Use the MOVE keyword to direct the DirX Directory auditing service to close and rename the audit file currently in use and to create a new empty audit log file, when the audit log file is full.
Saving the Data in the Audit Log File
The audit log file is located in install_path*/server/audit/audit.log*. You can’t change this audit log file name and location, nor is there any way to move the data in the audit log file automatically to another location when it becomes full. Instead, you must explicitly move the data out of the audit log file and into another file using the dirxadm command:
audit modify -move
If you use this command, dirxadm moves the data in the audit log file into a new file in the same directory, which it names in the format:
audit.log.date_nnn
where date is where date is the current UTC time in ZULU format in the form YYYYMMDDhhmmssZ and nnn is a counter from 000 to 999. For example, audit.log.20010510104511Z_001 is the filename for an audit log file created on 10 May 2001 at 10:45:11 hours.
To select your own pathname for a saved audit log file, use the dirxadm command:
audit modify -move -destination filename
where filename is the complete pathname you give to the saved audit log file.
When you empty the audit.log file by moving its contents to another file, the auditing service recreates the audit.log file and starts writing data into it again.
Using LDAP Auditing
The LDAP server provides its own auditing system, which is independent from the DSA audit.It is disabled by default, but can be enabled at any time to write information about processed LDAP requests to a file.DirX Directory LDAP auditing includes the following features:
-
Configurable audit detail level to trace either full request parameters or just a minimum subset.
-
Configurable filters for operation types
-
Configurable log file size with automatic overflow handling
-
Enabling/disabling at runtime
-
Timed start/stop
-
Data encryption
-
Session tracking
The next sections describe how to set up and manage LDAP auditing.
Creating the LDAP Audit Subentry
Audit behavior is controlled by an extra audit subentry that contains attributes that control the default audit operations. If you want to configure LDAP auditing, you must add this subentry to the database. The DirX Directory installation provides a dirxcp Tcl script that installs this subentry (CN=ldapAudit) with default settings. See the file:
install_path/scripts/stand_alone/default/ldap_auditcfg.cp
If an audit subentry with the common name ldapAudit is present in the database, the setting from this subentry is used to control the audit. If the name of the subentry is to be different, you must add the common name (for example, ldapAudit2) as a link to the attribute LACCN (ldapAuditCfgSubentryCN) in the LDAP configuration subentry.
Enabling LDAP Auditing
There are two ways to enable auditing:
-
At startup time
-
At runtime
To enable LDAP audit at startup, an audit subentry must exist in the database, the link to this subentry bust be filled correctly in the LDAP configuration subentry, and the attribute LAON (ldapAuditOn) must be set to TRUE in the audit subentry.
To enable audit during runtime, you can use the following dirxadm commands:
dirxadm ldap binding
dirxadm ldap audit -start
After these commands complete successfully, LDAP auditing is turned on and runs with the default settings.
| You can also use DirX Directory Manager and dirxextop to enable audit during runtime. |
Viewing the Current Audit Settings (dirxadm)
To retrieve the current audit settings, use the command:
dirxadm ldap audit -info
This command displays the active audit parameters. Here is an example:
==================== LDAP Audit Info  ===========
Hostname          : MYHOST01
Current Local Time: Fri Apr 12 13:10:09 2002
Status            : ON
Destination File  : C:\Program Files\DirX\Directory\Ldap\audit\ldapConfiguration\audit.log
File Size Limit   : 50000 records
Overflow Policy   : wrapAround
Detail Level      : max
Value Limit       : 128
Op Selection      : all
Buffer Size       : 0
Start Time        : none
Stop Time         : none
Encryption        : none
These settings reflect the audit subentry attributes. See the DirX Directory Syntaxes and Attributes for a more detailed explanation of these attributes.
| You can also use DirX Directory Manager and dirxextop to retrieve the current audit settings. |
Stopping and Restarting LDAP Auditing (dirxadm)
Auditing can be stopped at any time by issuing the command:
dirxadm ldap audit -stop
To re-enable it, issue the command:
dirxadm ldap audit -start
Note that you can also use DirX Directory Manager and dirxextop to stop and re-enable audit during runtime.
Using Session Tracking
If an LDAP server receives a request it often does not have any information about the originating user. The following figure illustrates this fact:
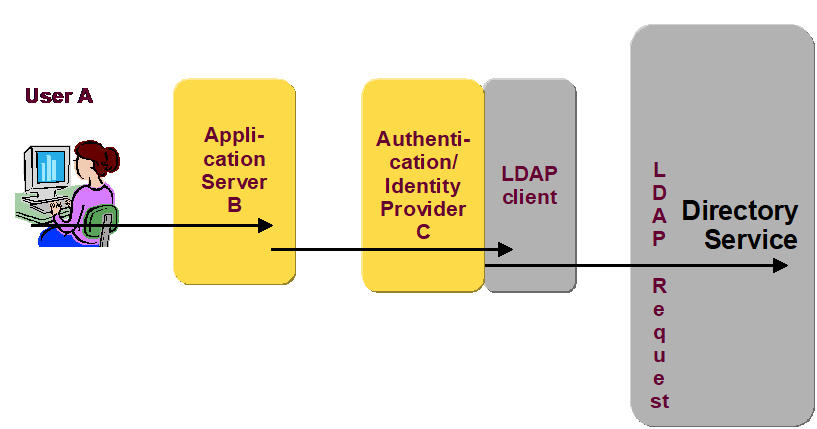
In the figure above, user A sends a request to application server B, for example, searching or modifying an entry. Before application server B performs user A’s request, it first checks the user A’s identity and reads user A’s profile through authentication / identity provider C. To fulfill the request of application server B, the authentication / identity provider C generates one or more LDAP requests to the directory service. If authentication / identity provider C does not include the LDAP session tracking control describing user A or application server B in the LDAP requests, the directory service only knows the IP address and the credentials of authentication / identity provider C, and an administrator is unable to track for example user A’s interactions.
The LDAP session tracking control enables the LDAP client to provide information about the originating user to the LDAP server. The LDAP session tracking control provides the following information:
-
The sessionSourceIP - The IP address of the originating LDAP client application with a maximum length of 128 characters.
-
The sessionSourceName - Describes the originating system with a maximum length of 65536 bytes.The value might be for example a hostname, a distinguished name, or a web service address.
-
The formatOID - Describes the semantics of the sessionSourceName and the sessionTrackingIdentifier with a maximum length of 1024 bytes.
-
The sessionTrackingIdentifier - The tracking identifier, for example, a username that has already been authenticated by the application that is generating the session, with an unlimited length (but should not be longer than 65536 characters).
If enabled, the DirX Directory LDAP server writes this information to the LDAP audit log file.Use the attributes LDAP Audit Session Tracking Enabled and LDAP Audit Session Tracking InfoLen of the LDAP Audit configuration subentry to enable and control logging of the LDAP session tracking control.(See the section “Attributes for LDAP Server Audit Configuration” in the DirX Directory Syntaxes and Attributes for details.)
See the Internet-Draft “LDAP Session Tracking Control” (draft-wahl-ldap-session-03.txt) for details about session tracking.
Evaluating the Audit Log File
Both the LDAP server and DSA write the audit log file as a binary file that must be converted to another format in order to use it.Use the dirxauddecode program to convert the audit log file from binary format to one of the following formats:
-
ASCII format—select ASCII format if you want to be able to read the file
-
“Exported” format—select exported format to generate an intermediate binary record format that an accounting or billing application can process
To run dirxauddecode on a Windows system:
-
Click Start.
-
Search for Command Prompt, and then click it.
-
For DSA auditing, change directory to install_path\server\audit. For LDAP auditing, change to install_path\ldap\audit\ldapConfiguration
-
Enter the dirxauddecode command, for example:
dirxauddecode -i audit.log.20010510104511Z_001 -a auditlog.txt
See the dirxauddecode section in the DirX Directory Administration Reference for a complete description of dirxauddecode command line syntax.The section in the DirX Directory Administration Reference that describes the dirxadm audit object shows a sample ASCII-output audit log file.
Use the dirxaudstatistics program to evaluate multiple binary audit log files.See the dirxaudstatistics section in the DirX Directory Administration Reference for a complete description of dirxaudstatistics command line syntax.
| You can also use DirX Directory Manager and dirxextop to evaluate audit settings. |
Using DirX Directory Diagnostic Logging
DirX Directory supports the logging of two types of diagnostic messages:
-
Exception messages, which are ASCII-formatted messages that are human-readable
-
Trace messages, which are binary formatted messages that must be decoded
DirX Directory provides tools to log trace and exception messages for clients; that is, DirX Directory applications such as dirxadm, dirxcp, and the LDAP server, and servers; that is, the DSA.The DirX Directory tools for diagnostic logging are:
-
The DirX Directory client, server, and tools logging configuration files, which control the level and type of trace and exception logging
-
The dirxadm sys log and sys nolog commands, which you use to switch between levels of diagnostic logging
-
The dirxadm ldap log and ldap nolog commands, which you use to switch between levels of diagnostic logging
-
The dirxdumplog program, which decodes trace log files so that you can read them
-
The DirX Directory client log directory, which is the default repository for logged client exception and trace messages
-
The DirX Directory server log directory , which is the default repository for logged server exception and trace messages
-
The DirX Directory LDAP server log directory , which is the default repository for logged LDAP server exception and trace messages
-
The DirX Directory tools log directory , which is the default repository for logged tools exception and trace messages
Although diagnostic logging is primarily carried out by programmers, DirX Directory administrators may want to set up diagnostic logging and then pass the log files on to programmers for analysis in the event of a serious problem.The next sections provide a summary of the diagnostic logging tools and how to use them.See the DirX Directory Administration Reference for complete details about these tools.
Using the Logging Configuration Files
DirX Directory supplies:
-
A set of client logging configuration files for the DirX Directory applications (clients) in the client directory install_path*/client/conf*
-
A set of server logging configuration files for the DSA (server) in the server directory install_path*/server/conf*
-
A set of LDAP server logging configuration files for the LDAP server in the LDAP server directory install_path*/ldap/conf*.
-
A set of tools logging configuration files for the tools like dirxload in the tools directory install_path*/tools/conf*
The purpose of two of these files is to specify:
-
The DirX Directory client and server subcomponents for which to capture trace messages and the debug level of the traces to log
-
The severity of exceptions to log and how and where to log them
One of the files (dirxlog.on) specifies the level of trace and exception logging that should occur in the “on” state.The other file (dirxlog.off) specifies the level of trace and exception logging that should occur in the “off” state.A third file (dirxlog.cfg) is used as the link to the “on” and “off” files.The first two files thus represent the “on/off” positions for the type and level of diagnostic logging performed for client and server, while the link file is used to switch between them.
The logging configuration files delivered with DirX Directory specify default “on” and “off” levels for client and server diagnostic logging.The DirX Directory default “on” file for client and server diagnostic logging enables a default level of trace and exception logging.The client and server “off” files completely turn off trace logging, but keep the default exception logging enabled.DirX Directory is delivered so that the “off” levels are in force.You can tailor the client and server logging configuration files to specify your own “on” and “off” levels of diagnostic logging for client and server.See the “DirX Directory Files” chapter in the DirX Directory Administration Reference for complete details about the format of these files.
Enabling and Disabling Diagnostic Logging
DirX Directory clients perform diagnostic logging according to the settings stored in the client configuration file install_path/client/conf/dirxlog.cfg.In order to switch between “on” and “off” levels of diagnostic logging, you must explicitly copy the information in the dirxlog.on and dirxlog.off files to the dirxlog.cfg file.
The DirX Directory DSA performs diagnostic logging according to the settings stored in the server configuration file install_path/server/conf/dirxlog.cfg.To switch between “on” and “off” diagnostic logging settings for the DirX Directory DSA, you use the dirxadm sys log and sys nolog commands.When you issue the dirxadm sys log command, the dirxadm program reads the logging level settings stored in the file install_path/server/conf/dirxlog.on and sends them to the DSA, which then logs according to the settings.When you issue the dirxadm sys nolog command, dirxadm reads the settings stored in the file install_path/server/conf/dirxlog.off and sends them to the DSA, which then logs according to the settings.When a DSA is restarted, it logs according to the settings it finds in the dirxlog.cfg file.
The DirX Directory LDAP server performs diagnostic logging according to the settings stored in the server configuration file install_path/ldap/conf/dirxlog.cfg.To switch between “on” and “off” diagnostic logging settings for the DirX Directory LDAP server, you use the dirxadm ldap log and ldap nolog commands.When you issue the dirxadm ldap log command, the dirxadm program reads the logging level settings stored in the file install_path/ldap/conf/dirxlog.on and sends them to the LDAP server, which then logs according to the settings.When you issue the dirxadm ldap nolog command, dirxadm reads the settings stored in the file install_path/ldap/conf/dirxlog.off and sends them to the LDAP server, which then logs according to the settings.When an LDAP server is restarted, it logs according to the settings it finds in the dirxlog.cfg file.
DirX Directory tools like dirxload perform diagnostic logging according to the settings stored in the client configuration file install_path/tools/conf/dirxlog.cfg.In order to switch between “on” and “off” levels of diagnostic logging, you must explicitly copy the information in the dirxlog.on and dirxlog.off files to the dirxlog.cfg file.
You can override this process by using the environment variable DIRX_LOGCFG_FILE to establish your own server logging configuration file.When this environment variable is set, all processes perform diagnostic logging using the settings contained in the file specified by DIRX_LOGCFG_FILE.The dirxadm sys log command and the dirxadm ldap log command send the settings in the logging configuration file specified in DIRX_LOGCFG_FILE to the DSA or LDAP server, while dirxadm sys nolog sends the settings in install_path/server/conf/dirxlog.off to the DSA, and dirxadm ldap nolog sends the settings in install_path/ldap/conf/dirxlog.off to the LDAP server.
The following figure illustrates how the logging configuration files are used depending on how a DirX Directory administrator initiates logging.
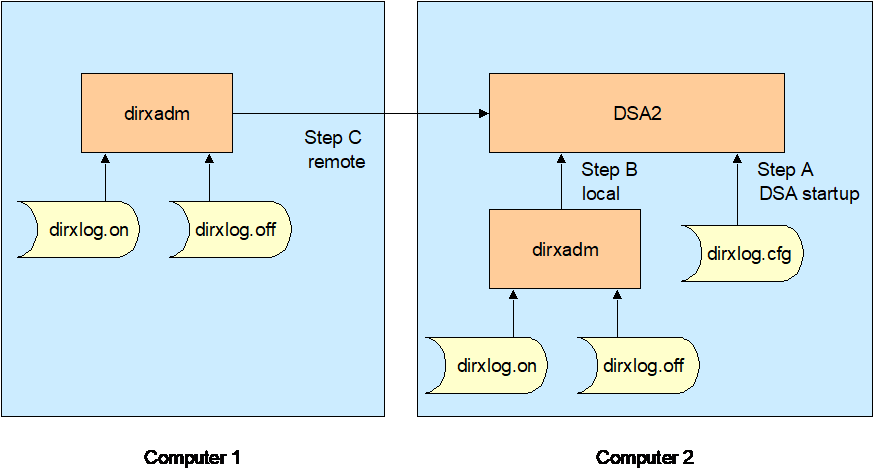
As illustrated in the figure:
-
When a DirX Directory administrator starts the DirX Directory service on computer 2, for example, when he boots the computer or sends a dirxadm sys start command, DSA 2 reads the values for logging configuration from the file install_path/server/conf/dirxlog.cfg on computer 2. This procedure is shown in step A.
-
When a DirX Directory administrator uses dirxadm on computer 2 to turn on logging (the local case) the values saved in the file install_path/server/conf/dirxlog.on on computer 2 are read and sent to DSA 2. DSA 2 then logs according the values sent but does not save them in the file install_path/server/conf/dirxlog.cfg on computer 2. If an administrator stops DSA 2 and starts it again for any reason (for example, a reboot of computer 2), DSA 2 logs according the values of
install_path/server/conf/dirxlog.cfg on computer 2 and not according the values sent the last time by one of the administration tools. This procedure is shown in step B. -
When a DirX Directory administrator uses dirxadm on computer 1 to turn on logging (the remote case), the values saved in the file install_path/server/conf/dirxlog.on on computer 1 are read and sent to DSA 2. DSA 2 then logs according the values sent, but does not save them in the install_path/server/conf/dirxlog.cfg file on computer 2. If the administrator stops DSA 2 and starts it again for any reason (for example, a reboot of computer 2) DSA 2 logs according the values of
install_path/server/conf/dirxlog.cfg on computer 2 and not according the values sent the last time by one of the administration tools. This procedure is shown in step C.
The same procedures are performed when a DirX Directory administrator uses the administration tools to turn off logging, except that the values saved in the file
install_path/server/conf/dirxlog.off are used.
If DSA 2 should always use a particular set of logging values, the administrator must edit the logging configuration file install_path/server/conf/dirxlog.cfg on computer 2 to contain these values.
The same procedures are performed for an LDAP server when a DirX Directory administrator uses the dirxadm commands ldap log on or ldap log off.In this case, the dirxlog.* files for the LDAP server that are saved in the directory install_path/ldap/conf are used.
When a DirX Directory administrator sets the environment variable DIRX_LOGCFG_FILE, there is only one logging configuration file used for the DSA and LDAP server.The administrator can set this environment variable on computer 1 and on computer 2.
Refer to the DirX Directory Administration Reference chapters entitled "File Locations", "DirX Directory Environment Variables", and the section "Logging Configuration Files" in the chapter "DirX Directory Files" for complete details.
Locating and Reading the Diagnostic Log Files
The client and server logging configuration files supplied with DirX Directory also specify default locations to which client and server exception and trace logs are written.
On Linux systems, exception messages from clients are written by default to the client log directory install_path/client/log, exception messages from the DSA are written by default to the server log directory install_path/server/log, exception messages from the LDAP server are written by default to the LDAP server log directory install_path/ldap/log, and exception messages from tools like dirxload are written by default to the tools log directory install_path/tools/log.Exception messages are separated into log files of less serious events (named USRprocessID by default) and log files of exceptions (named EXCprocessID by default).It is possible to administer DirX Directory and the Linux systems to use the system log daemon additionally.(See the section “syslog Configuration File” in the chapter “DirX Directory Files” in the DirX Directory Administration Reference for details.)
On Windows systems, exception messages from clients, servers, and tools are stored in the Windows event log, which you view with the Event Viewer.
Trace log messages are also written by default to the install_path/client/log, install_path/server/log, install_path/ldap/log, and install_path/tools/log directories but are written to a binary file (named LOGprocessID by default).You can use the logging configuration files to specify your own log file pathnames to which trace and exception messages are written rather than using the defaults.
The exception log files are human-readable ASCII files.
Trace log files are not human-readable.In order to read a trace log file, you must first process it with the dirxdumplog program.The section on dirxdumplog in the DirX Directory Administration Reference describes the dirxdumplog program syntax and provides an example of the program’s output.
Checking Database Consistency
You can use the dbamverify command-line tool on a regular basis to check the consistency of the DirX Directory DBAM database.The dbamverify command can check:
-
The referential integrity of all attribute value blocks and tree blocks
-
The consistency of all directory-specific entries (DSEs) – each DSE is read in the context of this check and is verified with respect to DBAM level consistency, linkage of the entry in the tree, and ASN.1 encoding, schema and index consistency of its attributes
-
Attribute value index bit strings
-
Subordinate index bit strings
Specifying no option directs dbamverify to perform all consistency tests.The command returns an exit code of 0 on success or a 1 if it encountered an error.The text of the error message is displayed on stderr.
Because dbamverify locks the database for update operations while it runs, it is recommended that you take a backup of the database with dirxbackup and then run dbamverify on this archive off-line.The section “Managing Backups” provides an example of this approach.
For details on dbamverify and dirxbackup command-line syntax, see the DirX Directory Administration Reference.
Managing Backups
Saving backups of the directory’s database is one of the most important tasks of DirX Directory operation.Use only the dirxbackup tools for this purpose.Using non-DirX tools that access DBAM database files or devices can produce inconsistencies in the database and / or in the dirxbackup archive file.
You must use the dirxbackup command to save and restore a database or verify the consistency of a database archive that you created with dirxbackup.Saving a directory database does NOT require setting the directory in read-only mode, so it does not interfere with normal operation.
The dirxbackup command supports both full and delta backups.To restore a saved database, first restore the full backup archive and then restore all delta backups in the correct sequence.For details on dirxbackup command-line syntax, see the DirX Directory Administration Reference.
Here is a sample backup and database consistency-checking scenario:
-
Create a full backup every 24 hours - for example, at 12:00 pm - by creating a scheduled job that performs the following dirxbackup command:
dirxbackup –S dirxDB.date_Time -
Create delta backups every n hours; for example, every four hours. The actual frequency of delta backups depends on your requirements. To achieve this, create a scheduled job that performs the following dirxbackup command:
dirxbackup –Sd dirxDB.date_Time.delta.number -
Check the archives for internal integrity and completeness by performing:
dirxbackup –T dirxDB.date_Time dirxDB.date_Time.number -
If the checks on the archives perform successfully, perform the DBAM database consistency check on the archives with the dbamverify command.Specify the full backup archive first, followed by the delta backup archives in sequence, for example:
dbamverify dirxDB.date_Time dirxDB.date_Time.1 \

dirxDB.date_Time.2 …
Exceeding Database Limits
The following errors indicate that your DBAM database limits have been exceeded:
-
DBAM_NOFREEENTRYFOUND 11105
This error indicates that there are no more free blocks in a DBAM device.Use the dbamdevinfo command-line tool (see the dbamdevinfo section in the DirX Directory Administration Reference) to find out which DBAM device is full. -
DBAM_IMPLLIMITEXCEEDED 11102
This error indicates that a DBAM design limit is exceeded.For example, if the maximum number of child entries below a parent entry is exceeded, this error is logged.
If one of the errors above is logged, extend your database as described in the chapter titled “Extending the Directory Database” in the Disc Dimensioning Guide.