Using DirX Identity Web Admin
You can manage the DirX Identity Java-based Server completely through Web interfaces. Because the server interfaces are compatible with the JMX standard, you can use any JMX-compliant application to verify the status of the server or control its operation.
DirX Identity allows you to perform Web-based server administration through:
-
DirX Identity Web Admin, which is a specialized administration interface that allows you to verify and control the Java-based Server and also monitor the C++-based Server.
-
Any JMX application, which permits you to use your favorite JMX console to control the Java-based Server.
The topics in this chapter provide usage information about Web Admin and explain how to configure a JMX-compliant application to manage a Java-based Server.
Logging In (Web Admin)
To log in to Web Admin in non-SSL mode, start your browser and then enter the following URL:
http://server:_port_/admin
For example:
where myserver is the machine where your Java-based (IdS-J) server runs and 40000 is the port that you entered during initial configuration.
If you selected SSL for the Java-based Server during configuration, use the following URL to log in securely to Web Admin:
https://server:_port_/admin
For example:
where myserver is the machine where your Java-based (IdS-J) server runs and 40443 is the port that you entered during initial configuration.
Web Admin displays a login dialog that requests username and password (default: admin / wE3!dirx).
About the Web Admin Page Layout
The following figure shows the Web Admin page layout:
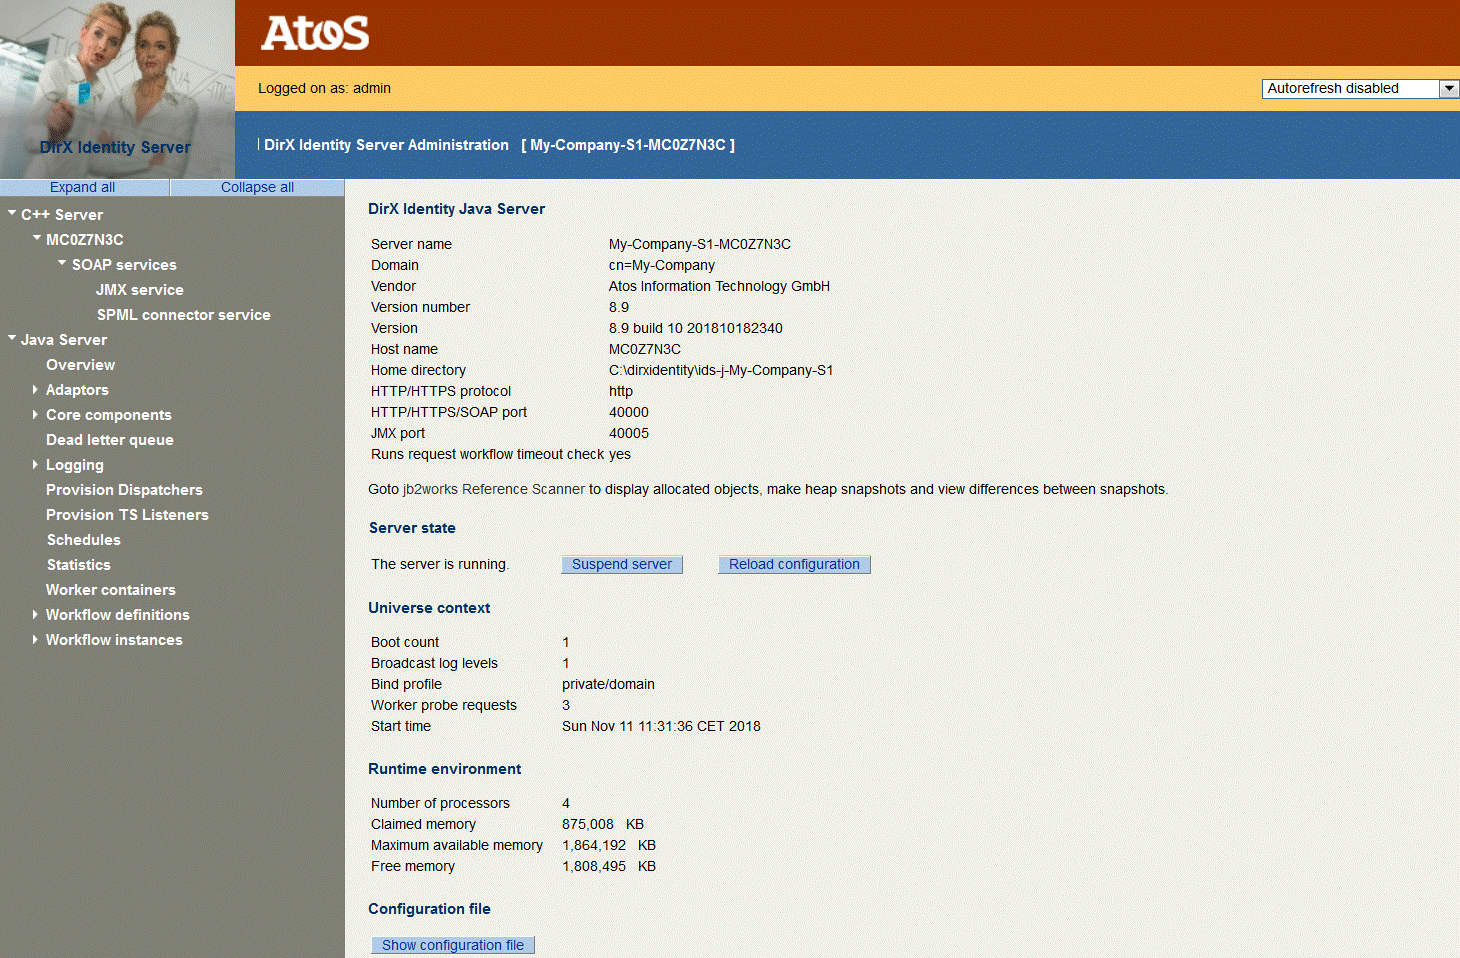
As shown in the figure, the default page layout consists of a header at the top, a footer at the bottom (not visible in the figure) and a navigation pane on the left-hand side.The rest of the page is application-specific.
All pages contain the same header, which consists of:
-
A company logo and company name
-
Information about the user login status, which is either Not logged on or Logged on as: username
-
An autorefresh chooser field - Click the arrow button and select your desired option.
Note: This option is only valid for the current page. It is automatically reset after an action or page change.
The navigation pane consists of a list of nodes that represent a Java-based Server and a C++-based Server.
Note: This version of Web Admin supports only one Java-based server node and one C++-based Server.Use the Server Admin for multiple servers or multiple instances of the Web Admin to control multiple server instances.
Items with a leading triangle contain a sub-structure.Click the triangle to open or close the sub-structure.
Use the Expand All and Collapse All buttons to open or close all sub-structures.
The footer of the page contains the application version number on the left and other useful maintenance information.
The next sections explain the sub-structure of the different server types.
Using the C++-based Server Menu
When you open C++-based Server in the navigation pane, Web Admin displays a list of services contained in the primary C++-based Server that you can manage.Click a server node to manage the following services:
-
SOAP services - the list of SOAP services for the C++-based Server.
SOAP Services
This selection displays information about the C++-based Server’s SOAP services.The JMX service handles all requests for maintenance; the Java-based Server uses it to send maintenance requests to the C++-based Server and to receive the response information.The SPML connector service handles all messages to and from the connector service.
Each SOAP service selection displays the following information:
-
Port - the port number the Java-based Server uses to access the C++-based Server to exchange information.
-
Accept timeout - the amount of time to wait for the accept information of a sent SOAP message.
-
Receive timeout - the amount of time to wait for the receive message of a sent SOAP message.
-
Current thread count - the current number of threads running for this service.
-
Busy thread count - the current number of busy threads.
-
Thread count high water - the maximum number of threads allowed for this service.
Managing the Java-based Server
In the Web Admin navigation pane, you can handle:
-
Java Server - the top-level node represents the server itself, its state and loaded configuration.
-
Overview - shows an overview of the most important parameters.
-
Adaptors - components that control various event input channels.
-
Core components - global server components.
-
Dead letter queue - keeps all events that were not successful for viewing and reprocessing.
-
Logging - allows setting log levels and viewing log files.
-
Provisioning Dispatchers - special JMS adaptors that read messages for running Provisioning workflows.
-
Provisioning Target System Listeners - read messages for provisioning target systems that should be processed only on dedicated servers.
-
Resolution Adapter - resolves users.
-
Schedules - shows all running schedules. The full checker runs as the default scheduler.
-
Statistics - displays server statistics information.
-
Worker containers - the available worker threads.
-
Workflow definitions - the list of active workflows loaded into the server and waiting for events.
-
Workflow instances - running workflows and schedules.
Managing the Server State
The Server State page allows you to control the Java-based server state and provides the following sections:
-
DirX Identity Java Server - provides general information.
-
Server State - displays information about the server state and allows you to manage the server.
-
Universe Context - shows boot information.
-
Runtime Environment - displays information about the memory and processors.
-
Configuration File - displays the current loaded and resolved server configuration in XML format.
DirX Identity Java Server
The general information provided is:
The Server name.
The Domain.
The Vendor.
The Version number.
The Version.
The Host name.
The Home directory.
The HTTP/HTTPS protocol.
The HTTP/HTTPS/SOAP port.
The JMX port.
The Run request workflow timeout check flag.
Server State
The Server State area displays the following fields and buttons:
The server is … - whether the server is running or suspended.
Click Suspend Server to suspend the server, click Resume Server to start it again.
Click Reload Configuration to reload the workflow configuration from the LDAP configuration database (this action has same effect as using the Load IdS-J Configuration selection from the context menu of a server or workflow item in the DirX Identity Manager).
Universe Context
The Universe Context area displays the following boot information:
Boot count - the number of server starts on this machine.*
Broadcast Log Levels* - the number of times the log level has changed.*
Bind profile* - the folder that contains the domain bind credentials.*
Worker probe requests* - the number of times the worker threads of the server have been polled.*
Start time* - the time at which the server was last started.
Runtime Environment
Displays information about memory and processors:
Number of processors - the number of available processors on this machine.*
Claimed memory* - the amount of memory already claimed by the server process.*
Maximum available memory* - the maximum amount of available memory.*
Free memory* - the amount of memory that is still available.
Overview
The Overview page displays the most important parameters. Follow the link (underlined text strings) to display details. The information displayed is:
-
State - information about the server state. Click the link to view details.
-
SEVERE - the number of severe errors that have occurred since server start. Click the link to view the server log files. (See the section "View log files" for details).
-
WARNING - the number of warnings that have occurred since server start. Click the link to view the server log files. (See the section "View log files" for details).
-
Memory - the maximum memory configured and the amount that is currently consumed.
-
Pending Requests - the maximum number of pending requests configured and the number currently used.
-
Workflows - the number of workflow instances. View the Workflow Instances section for details.
-
Retry - the number of workflow instances waiting for retry. These instances wait due to a recoverable error that has occurred. Click the link for details.
-
DeadLetterQueue - the number of entries in the dead letter queue. Click the link to display information about the dead letter queue. (See the section "Dead Letter Queue" for details.)
-
Audit channel - the number of audit requests waiting at the audit channel.
-
Logging channel - the number of logging requests waiting at the logging channel.
-
Adaptor - a summary of all configured adaptors. In the Pending Requests column, you can see the configured maximum number of requests and the currently available ones. Click the link to view the details of this adaptor. (See the corresponding adaptor section for details.)
-
Resource Family - the workers that are configured for a specific resource family. The Tasks column displays the number of waiting tasks (for example, a batch of password changes). In the Workers column, worker icons in green indicate running threads; worker icons in gray are waiting threads. Click the link to display the table of workers. (See the section "Worker Containers" for details.)
The server writes snapshots of this page in HTML format as separate files (snapshot-timestamp-counter.html) onto disk into the folder install_path\logs\overview. Use the parameter Maximum No. of Overview Files in the tab Status and Auditing of the Java-based Server object in the Connectivity view group of the DirX Identity Manager to control the maximum number of files.
Each time you open or refresh the Overview page, a snapshot file is written. Use the Autorefresh feature to write pages regularly, for example each 5 minutes. This action allows you to view the server history later on. Click the link at the top of the table to view the list of overview files.
Managing Adaptors
Adaptors listen for incoming events and pass them to the JavaSpace for processing. Adaptors exist for external and internal events, including:
-
Account Password Change Listener - listens for account password changes.
-
Admin Request Handler - handles all administrative requests.
-
Backup Slave Listener - listens for all JMS events and stores them in its repository until the events are processed (active only if High Availability is enabled).
-
Configuration Handler - handles requests from Windows Password Listeners.
-
Entry Change Listener - listens for entry changes.
-
Entry Change Start Workflow Listener - listens for events starting event-based processing workflows; can be active only if the Entry Change Listener is also active.
-
Import to Identity Listener - listens for events that indicate a change in an entry in a remote system (for example, a user in an Active Directory) that needs to be imported into the DirX Identity domain.
-
Mail Listener - listens for notification events (mail requests).
-
Password Change Listener - listens for external password change events.
-
Provisioning Request Listener - listens for provisioning request events for real-time workflows.
-
Provisioning Request Start Workflow Listener - listens for events starting Provisioning workflows; can be active only if the Provisioning Request Listener is also active.
-
Request Activity Task Listener - listens for events intended to start an activity in a request workflow.
-
Request Workflow Workflow Engine Listener - listens for events from external or any other Java-based Server to trigger the workflow engine component.
-
Set Account Password Listener - listens for account password change events.
-
Text Message Listener - listens for text message events (SMS requests).
Adaptor States
Adaptors can have the following states:
-
Listening - The adaptor listens for incoming events.
-
Waiting - The adaptor is blocked because the high water mark has been exceeded. It waits until the low water mark is reached.
-
Suspended - The adaptor is blocked due to administrator’s intervention.
Temporary states are:
-
Recovering - the adaptor is reading events from the persistent repository after server start.
-
Recovered - the adaptor has finished reading events. It’s going to state Listening.
-
Terminating - the adaptor is stopping.
-
Terminated - the adaptor is stopped.
Account Password Change Listener
Entry Change Listener
Entry Change Start Workflow Listener
Import to Identity Listener
Mail Listener
Password Change Listener
Provisioning Request Listener
Request Activity Task Listener
Provisioning Request Start Workflow Listener
Request Activity Task Listener
Request Workflow Workflow Engine Listener
Set Account Password Listener
Text Message Listener
The Account Password Change Listener listens for account password change events.
The Entry Change Listener listens for entry change events.
The Entry Change Start Workflow Listener listens for messages to start event-based processing workflows.
The Import to Identity Listener listens for events that indicate changes to entries in remote systems that must be imported into the DirX Identity domain.
The Mail Listener listens for notification events.
The Password Change Listener listens for password change events.
The Provisioning Request Listener listens for Provisioning requests.
The Provisioning Request Start Workflow Listener listens for messages to start Provisioning workflows.
The Request Workflow Workflow Engine Listener listens for events to trigger the workflow engine component.
The Set Account Password Listener listens for account password change events.
The Text Message Listener listens for text message events (SMS requests).
Web Admin displays a message that indicates whether the listener is running or suspended. Click Suspend or Resume to stop and start the adaptor.
The properties of these components are:
-
State - the state of this listener. (See the section "Adaptor States" for details.)
-
Is Persistent - whether the listener stores received events in its persistent repository until processing is finished.
-
Number of sent requests - the number of requests sent to the JavaSpace for processing since the last server start.
-
Number of received responses - the number of responses for sent requests received from processing workflows since the last server start.
-
Number of outstanding responses - the number of current outstanding responses for sent requests received from processing workflows. This field indicates the number of events that are not yet finished.
-
Host - the host name where the server runs.
-
Port - the port where the server runs.
-
Client ID - the listener’s client ID.
-
Subscription ID - this server’s subscription identifier to specific messages. If the listener receives messages from a queue, the subscription ID is not set.
-
Character set - the expected character set for the sent requests.
-
Topic - the topic associated with the listener’s function.
-
Retry interval (in milliseconds) - the connection loss time between two re-connects.
-
High watermark - the number of outstanding requests after which the listener stops operation. The listener resumes operation when the low watermark is reached.
-
Low watermark - the number of outstanding requests after which the listener resumes operation after a high watermark is reached.
Backup Slave Listener
The backup slave listener listens for all JMS events in a High Availability environment. JMS adaptors of the monitored Java-based Server send a copy of all incoming events (called add events) to the backup slave listener. When the event is processed, a delete event is sent to the backup slave listener to delete the event from its repository. If the other Java-based Server fails, the replicated events can be replayed.
Web Admin displays a message that indicates whether the listener is running or suspended. Click Suspend or Resume to stop and start the adaptor.
The properties of this component are:
-
State - the state of this listener. (See the section "Adaptor States" for details.)
-
Is Persistent - whether the listener stores received events in its persistent repository until processing is finished.
-
Number of received ADD events - the number of events sent to the listener for storing since the last server start.
-
Number of received DEL events - the number of events for deleting them in the local repository since the last server start.
-
Number of replayed events - the number of replayed events since the last server start.
-
Host - the host name where the server runs.
-
Port - the port where the server runs.
-
Client ID - the listener’s client ID.
-
Subscription ID - this listener’s subscription identifier.
-
Character set - the expected character set for the sent requests.
-
Topic - the topic associated with events to backup.
-
Retry interval (in milliseconds) - the connection loss time between two re-connects.
Admin Request Handler
The admin request handler listens for requests for configuration updates and processes them.
Web Admin displays a message that indicates whether the adaptor is running or suspended. Click Suspend or Resume to stop and start the adaptor.
The properties of this component are:
-
State - the state of this listener. (See the section "Adaptor States" for details.)
-
Number of sent requests- the number of events sent to the JavaSpace for processing since the last server start.
-
Number of received responses- the number of responses for sent requests received from processing workflows since the last server start.
-
Host - the host name where the server runs.
-
Port - the port where the server runs.
-
Client ID - the listener’s client ID.
-
Character set - the expected character for the request.
-
Topic - the topic associated with configuration changed event messages.
-
Retry interval (in milliseconds) - the interval between two accesses to the messaging service. Set it accordingly.
Click Save to save changes. Click Reset to discard changes and re-set all values to the most recently saved values.
Configuration Handler
The configuration handler listens for requests from components that need a current certificate a list of messaging services. The list of messaging services is also broadcast per scheduler.
Web Admin displays a message that indicates whether the adaptor is running or suspended. Click Suspend or Resume to stop or start the adaptor.
The properties of this component are:
-
State - the state of this listener. (See the section "Adaptor States" for details.)
-
Number of sent requests - the number of certificate requests that were read from the messages queue; for example, from the Windows Password Listener.
-
Certificates sent - the number of certificates published as result of received requests.
-
Host - the host name where the server runs.
-
Port - the port where the server runs.
-
Client ID - the listener’s client ID.
-
Subscription ID - this server’s subscription to request certificate messages.
-
Character set - the expected character set for the sent requests.
-
Topic - the topic associated with certificate request publications.
-
Broadcast topic - the topic the certificate handler uses to publish changed certificates.
-
Retry interval (in milliseconds) - the interval between two accesses to the messaging service. Set it accordingly.
-
Broadcast interval (in minutes) - the interval between two broadcasts of the list of messaging services. Set it accordingly. This property is only shown for the Configuration Handler.
Click Save to save the changes. Click Reset to discard the changes and re-set all values to the most recently saved values.
Provisioning Dispatchers
Provisioning dispatchers read messages for provisioning target systems and dispatch them either to the appropriate target system-specific queue or to the respective default queue (for example, domain*.dxm.request.provisiontots._default*).
For each of the provisioning queues, the detail page shows the number of messages that have been received, how many of them could not be dispatched due to an error, how many have been dispatched and whether to the default or to a target system-specific queue.
Provisioning Target System Listeners
Listeners specific to a target system read and process messages for that target system. If there is no target system, the messages apply to the connected directory. The listeners are started only on the dedicated servers. The number of listeners per queue depends on the configuration of the connected directory.
For each target system, the detail page shows the listeners for three queues (dxm.request.provisiontots, dxm.request.workflow.provisioning, dxm.setpasswordrequest) with the following counters:
-
Messages Received - the total number of messages received.
-
Messages Re-Delivered - how many messages were re-delivered due to failure.
-
Messages Failed Temporary - how many messages failed temporarily. When a failure is considered to be temporary, the listener tries to re-deliver it to process it after the retry time has expired.
-
Messages Failed Final - how many messages failed finally. A message fails finally if the error is not temporary or the maximum number of retries has been reached.
The queue names are suffixed with a target system identifier. It is built using the attributes type, cluster and domain of the target system in lower case: type.cluster.domain. For a target system that is part of a cluster, the domain part is empty and the target identifier is built as type.cluster. For more information on this topic, see the chapter “Managing DirX Identity Servers” → “Distributed Deployments and Scalability” → “Separating Traffic for Selected Target Systems” in the DirX Identity Connectivity Administration Guide.
Resolution Adapter
The resolution adapter is a JMS adapter that is responsible for resolving users. It listens to JMS messages in the queue domain*.dxm.request.user.resolve*.
The WebAdmin detail page allows you to monitor the adapter and shows the following fields, mostly counters. Note that the adapter registers a number of listeners at the queue. This is configured in the domain configuration entry.
-
Connected - whether the adapter is currently connected to the Message Broker.
-
Connection starts - how often the adapter has started a JMS connection.
-
Exceptions received from JMS connection - how many exceptions have been received from the Message Broker. Such an exception typically means that the JMS connection is lost.
-
JMS re-bind attempts - how often the adapter has tried to re-bind to the Message Broker after the connection was lost.
-
Messages Received - the total number of messages that have been received.
-
Messages Succeeded - how many messages have been processed successfully and resolved the user.
-
Messages Re-Delivered - how many messages were re-delivered due to failure.
-
Messages Failed Temporary - how many of them failed temporarily. When a failure is considered to be temporary, the adapter tries to re-deliver it to process it after the retry time has expired.
-
Messages Failed Final - how many of them failed finally. A message fails finally if the error is not temporary or the maximum number of retries has been reached.
-
Messages Ignored - how many of the received messages were ignored. A message is ignored if the user already has been resolved after the change that this message represents. Note that the message contains the time of the change. The adapter adds a grace period to cope with potential time differences at client and server.
Managing Core Components
This section shows detailed information about the internal state of the server.
Space
This section shows information about the internal workspace of the server that is only important for debugging purposes. It lists the entries currently stored in the JavaSpace repository of the server. The JavaSpace is a persistent repository that holds all requests and responses exchanged internally between all the server components and the attached workers.
The view represents a snapshot of the active communication channels and workers and of the requests waiting for processing. They are ordered according to their types (their class names).
Dead Letter Queue
If no error activity is configured for a workflow or a failed request cannot be processed by the workflow, the request is placed in the Dead Letter Queue. This part of the Java-based Server administration interface allows you to view the failed requests and responses and to delete them or to process them again.
Web Admin displays a message that indicates whether the adaptor is running or suspended. Click Suspend or Resume to control the adaptor.
The first section of properties shows the status of the queue:
-
State - the state of this listener (listening or suspended).
-
Is Persistent - whether or not received events are stored in its persistent repository until processing is finished.
-
Number of stored requests - the number of failed requests that are stored here in the internal queue.
-
Number of sent requests - the number of requests that were re-sent to the workflow dispatcher and removed from the dead letter queue as well.
-
Number of received responses - the number of requests the workflow dispatcher has processed successfully after re-sending them to the dispatcher.
-
Number of outstanding responses - the number of (pending) requests the workflow dispatcher is processing.
The next two items let you control the maximum number of requests in this queue:
-
High water mark - if the number of outstanding requests is higher than this limit, the listener stops working. It starts again when the low water mark is reached. Set it accordingly.
-
Low water mark - the listener starts working again if the number of outstanding requests is lower than this limit. Set it accordingly.
Click Save to save the changes and Reset to discard the changes and to re-set all values to the most recently saved values.
You can view, process, or delete stored requests. Define a filter to get a part of the stored requests:
-
Topic - the filter for topics to work on. You can use the asterisk (*) as a wildcard sign. It is not possible to enter a NOT expression.
For an explanation of topic formats, see the section "Message Topics" in the DirX Identity Connectivity Administration Guide. -
Time from … to … - the time frame for the requests. Use generalized time formats like 20140108010000Z.
-
Sort by - the sort criteria of the search result. Valid values are: none, topic, timestamp, expires.
-
Order - specifies ascending or descending order.
-
Maximum number of requests - the maximum number of requests to be retrieved (default: 100).
-
Timeout for processing (sec) - the time limit for handling search and process commands.
Use Reset filter to reset the filter.
Use Search requests to generate a list of requests and determine what the errors are. See "Handling the Search Result" below for details.
If you are able to remove the reason for the error - for example, by changing the configuration or re-starting the target system - you can alternatively click Process requests. The handler removes the entries from the queue and sends them to the workflow dispatcher, which selects appropriate workflows to process the requests again.
The last part of this page allows you to clear all requests with a specific topic:
-
Topic - define the topic filter and then click Clear requests to remove these requests from the dead letter queue.
Handling the Search Result
The result of a search request is displayed in a list. The displayed columns are:
Topic - the topic of the failed event.
Data - three additional columns display more detailed data according to the event type (topic).
Details - the content of this entry in a separate page. For more information see below.
Process - processes this entry again.
Remove - deletes this entry.
The Details feature shows these fields of an entry:
Request ID - the internal identifier of this request.
Adaptor Name - the name of the adaptor that delivered this event.
Topic - the complete topic.
Creation time - the time at which this event was received by the adaptor.
UID - a unique internal identifier.
Error code - the error code. Possible values are:
1 (Missing response from workflow: …) - the workflow dispatcher did not get a response from the workflow or a temporary error could not be resolved via retries.
2 (No workflow found for event, context: …) - no workflow was found with a matching When applicable section
3 (specific_message) - a workflow encountered a specific problem (see the specific_message for more information).
Error annotation - a description of the error code.
Connected directory type - the first variable of the event.
Cluster - the second variable of the event.
Resource - the third variable of the event (named Domain in the DirX Identity Manager).
Identifier - the target of this event (for example, the user DN for a password change or the account or group DN for provisioning events).
Event - the event content itself, in SPML format. Use the Wrap lines box to change the display mode of the text box.
Use the Back to request list button to return to the request list. Use the  and
and  buttons to step through the detail pages.
Logging
The Logging section allows you to configure and view server log information, including:
-
Set log levels - displays all components and lets you set the log levels.
-
View log files - displays a list of all log files.
See also the "Logging" section in "Managing the Java-based Server" in the DirX Identity Connectivity Administration Guide.
Set log levels
This subsection displays a list of all relevant components and their current log levels. You can add new components or change the log levels of existing ones.
The fields in the displayed list are:
-
Component - the component name. Standard components are:
Default - the default log level if nothing else is specified.
Activity engine - the engine to control activities.
Adaptors - the list of configured adaptors.
Configuration - the configuration manager.
Connectors - the list of configured connectors.
Filters - the list of configured filters (for example, the crypto filter).
Job - the list of configured jobs.
Scheduler - the scheduler component.
Space - the workspace handler (JavaSpace implementation).
Workflow engine - the engine to run workflows.
Workflow resolver - the component that retrieves the correct workflow for an event.
Other packages and classes - standard components for logging, auditing, …
New package or class - specifies a new package or class -
Sub component - the sub component name.
-
Package or class name - the corresponding Java class package or class.
-
Level - the log level. Valid values are:
DEFAULT - default logging level (see note below).
OFF - no logging.
SEVERE - severe errors.
WARNING - severe errors and warnings.
INFO - severe errors, warnings, and info messages.
FINE - severe errors, warnings, info messages and fine logging.
FINER - severe errors, warnings, info messages and finer logging.
FINEST - severe errors, warnings, info messages and finest logging.
ALL - all logging activated.
The log levels are arranged in sequential order, each level producing more log entries than the lower one. Level OFF produces no log records at all; SEVERE is for error messages, while FINEST contains debug messages usually comprising the message and configuration data.
The DEFAULT log level is special. The logging can be set for Java classes or package names. A package name is divided into parts separated by a period. All names are structured in a tree. The default log level is specified for the root of the tree. Underneath the root are the package part names like "com", "org", or "siemens". The second node in the tree hierarchy is then, for example, "com.siemens" or "org.apache" and so on. You can set a log level for each node. If not, a log level is set for a class, and then the first node for which a log level is set beginning from the class name to the root defines the effective log level for the class. If no log level is set for any nodes, ultimately the log level is taken from the root (the default log level).
The log settings are stored in a file permanently and survive server restarts.
Use the New package or class field to add a new component to the list (for example, a custom connector).
Use Save to save the changes and use Reset discard the changes and to re-set all values to the last recently saved values. Saving changes takes effect immediately.
Use:
-
Dump all threads to write all threads with stack trace and deadlock information to the file webAdminThreadDump.*counter.txt* in the folder logs. It also produces a file webAdminTasks.*counter.txt* in the folder logs with all tasks currently in the JavaSpace.
-
Dump top threads to write the 15 top threads that are consuming the most CPU resources to the file webAdminThreadTop.*counter.txt* in the folder logs.
-
Dump heap to write a memory heap dump for support diagnosis to the file webAdminHeap.*counter.hprof* in the folder logs.
-
Dump all loggers to write a list of all logger objects with detailed information for support diagnosis to the file webAdminAllLoggers.*counter.txt* in the folder logs.
View log files
Displays the complete list of log files from the server log folder.
See also the "Auditing", "Logging" and "Statistics" sections in "Managing the Java-based Server" in the DirX Identity Connectivity Administration Guide.
Available fields are:
-
Filename - the name of the file.
-
Size - the size of the file.
-
Last modified - the last modified date.
The displayed files are:
-
diaginfo-*timestamp-counter.txt* - files that contain diagnosis information for support.
-
classloader.txt - a file that contains all classes loaded.
-
overview - a folder that contains snapshots of the Overview page. The file names of the snapshots are snapshot-*timestamp-counter.html*. (See section "Overview" for details.)
-
readme.txt - a read-me file containing the string "Log files go here …"
-
server-*timestamp-counter.txt* - server log files.
-
server.xml - the current configuration with which the server is running.
-
serverstate.txt - the current server state with information about universe context, global context, loaded workflows, worker containers, and MBeans. By default, this file is re-written every hour. You may change the frequency for your IdS-J server in the Status and Auditing tab with DirX Identity Manager.
-
start.log - the startup logging information, which contains logs written before the server configuration (containing the log file name) was evaluated.
-
stderr.{1|2|3}*.log* - redirected output to standard error.
-
stdout.{1|2|3}*.log* - redirected output to standard out.
-
warning-*timestamp-counter.txt* - all error and warning log entries from the server log file.
Schedules
This menu entry displays all active schedules. These are timers that control the timeout of workflows and activities and the waiting time for activities that need retry.
The available columns are:
UID - an internal unique ID.
Time - the initial date for this schedule.
Task - information about the task to be performed.
By default, the Full check schedule is displayed. The workflow engine performs the full check to look for non-processed items. These items could exist if events were not correctly processed.
Statistics
The Statistics view shows statistics information since the last server start. It presents a set of counters that typically represent the number of received events and responses and of errors. The counters are reset to 0 when the server starts. See also "Statistics" in "Managing the Java-based Server" in the DirX Identity Connectivity Administration Guide.
Statistics are provided for:
-
Workflows
-
Events
-
Realtime workflows
-
Request workflows
Workflow Overview
This statistic provides the following information:
-
Number of processed workflows.
-
Number of resolved tasks.
-
Number of severe errors. (See log files for details and search for SEVERE.)
-
Number of warnings. (See log files for details and search for WARNING.)
Event Overview
This statistic provides the following information:
-
Number of requests.
-
Number of outstanding responses.
-
Number of supplemented responses.
-
Minimum duration.
-
Maximum duration.
Realtime Workflows
This statistic provides the following information:
-
Name - the name of the workflow.
-
Start - the number of workflows that SUCCEEDED and the number of workflows that FAILED.
-
Event - the number of events that SUCCEEDED and the number of events that FAILED.
-
Search - the number of search operations that SUCCEEDED and the number of search operations that FAILED.
-
Add - the number of add operations that SUCCEEDED and the number of add operations that FAILED.
-
Modify - the number of modify operations that SUCCEEDED and the number of modify operations that FAILED.
-
Delete - the number of delete operations that SUCCEEDED and the number of delete operations that FAILED.
-
UpToDate - the number of objects that were already up to date (no operation necessary).
Request Workflows
This statistic provides the following information:
-
Name - the name of the request workflow.
-
Workflows
-
Started - the number of request workflows that were started.
-
OK - the number of request workflows that succeeded.
-
Failed - the number of request workflows that failed.
-
Other - the number of request workflows with another status.
-
Activities
-
Started - the number of activities that were started.
-
Running - the number of activities that are in state RUNNING.
-
OK - the number of activities that succeeded.
-
Failed - the number of activities that failed.
Details
This section explains the details that are displayed if you click on a line in either the Real-time Workflows or Request Workflows table above.
Details for Realtime Workflows
-
Workflow Starts and States
-
Started - the total number of workflows started (sum of Succeeded and Failed fields).
-
Succeeded - the total number of workflows that succeeded.
-
Failed - the total number of workflows that failed.
-
UpToDate - the total number of up to date operations.
-
Event and Operations
-
Name - the operation name.
-
Events Processed - the number of succeeded and failed events.
-
Operations Performed - the number of succeeded and failed operations.
Details for Request Workflows
-
Workflow Starts and States
Lists counters for each status that occurred.
-
Activities
Lists counters for each activity / state combination that occurred.
Worker Containers
This section displays all running worker threads in this server. The columns in this list are:
-
Host - the host where either the server or the worker container runs.
-
Worker Container - a block of information for each worker container.
The first line of each Worker Container block provides the following information:
-
Worker container name - the name of the worker container (colocated represents the worker container running in the server itself).
-
Identifier - an internal unique identifier for this worker container.
The Worker Container block shows:
-
Worker name - the worker container name and a thread number.
-
Resource family - the resource family for which this thread is waiting. Possible values are:
{workflowengine} - the resource family is reserved for the workflow engine itself, which starts and controls workflow activities.
{scheduler} - the internal scheduler of the server, which handles timeout situations and triggers retry of activities.
{workflowscheduler} - the scheduler for real-time workflow schedules.
{resource family} - the specific resource family for which this thread is configured. You can configure the resource families and the number of threads for a Java-based Server at the corresponding configuration object in the Connectivity view (note that changing these parameters requires a restart of the corresponding Java-based Server). -
Status - one of the following values:
waiting for task - the thread is ready to take the next task._
identification of running task_ - this thread is currently running.
Watching this list, you can see the running and waiting worker threads. You can configure the resource families and the number of threads for a Java-based Server at the corresponding configuration object in the Connectivity view (note that changing these parameters requires a restart of the corresponding Java-based Server).
The details button  allows you to reduce the number of worker threads or create additional ones temporarily. This information is lost after Java-based Server restart.
After clicking the details button, these fields are displayed:
-
Host - the host where this worker container is running.
-
VMID - the internal unique ID of the Java virtual machine of this worker container.
-
Resource Family - the resource family with which the new thread works. Note that resource family names are case-sensitive.
Click Add or Remove to add or remove threads of this resource family type.
The Action field displays the number of threads that will be added or removed.
Click Save to perform the displayed action (creating the new worker threads and deleting worker threads). Click Cancel to go back to the Workers list without performing any action.
Workflow Definitions
This menu entry shows all loaded (active) workflow definitions. Three types of definitions can be available:
Realtime workflows - shows real-time workflow definitions.
Request workflows - shows request workflow definitions
Open the tree structure (click the triangles) to view the loaded definitions. The tree structure is identical to the folder structure visible in the DirX Identity Manager. Clicking a leaf node (there is no triangle before the entry) displays these fields:
Workflow Details
This subsection displays the configuration of all configured workflows. These fields are displayed:
-
Workflow Name - The (LDAP) path of the workflow in the Connectivity configuration.
-
Configuration Manager - The configuration manager class that loaded the definition.
-
Definition - The complete loaded (active) workflow configuration definition in XML format. This field allows you to check whether all parameters are set correctly after references are resolved.
Workflow Instances
This menu entry shows all workflow instances for the following types of workflows:
Real-time Workflows - shows the real-time workflow instances.
Request Workflows - shows the request workflow instances.
When you select a menu item, a dialog is displayed to specify a filter for selecting specific workflow instances. The following sections provide information about:
-
Using the filter.
-
Information displayed in the workflow instances table.
-
Workflow details.
Using the Filter
Specify specific parts of the workflow name and path, workflow states and / or a start and / or end time interval for selecting specific workflow instances:
-
Name / Path - specify a part of the workflow name and / or path.
-
Workflow state - check or uncheck the states of interest to you. For request workflow instances, use:
-
Select failed - to select all failed states.
-
Select all - to select all states.
-
Deselect all - to de-select all states.
-
Start date / End date - specify time intervals for start or finish time in the Started and Finished fields. The end date can be specified only for request workflows. Use:
-
Today - to specify the current date.
-
Since … days ago - to specify a time period in days.
-
Clear - to delete an interval or date.
-
Limits - specify the size limit for the search (for request workflows only).
Use:
-
Hide filter - to hide the filter specification area.
-
Change filter - to display the filter specification area and change the filter values.
-
Search - to start the search operation and display the selected workflow instances.
-
Reset - to discard the changes and to keep the previously specified filter values.
The filter definition remains valid until you restart the browser. After a browser start, all available states are selected and no start or finished in time interval is specified.
Workflow Instances Table
When you click Search, Web Admin searches the selected workflow instances and displays the result in table format. It displays the following information:
-
Name - the workflow instance name.
-
Path - the base components of the path to the workflow definition. The full path is displayed as a tool tip.
-
State - the state of the workflow instance.
-
Start Time - the time when the workflow was started.
-
End Time - the time when the workflow finished (request workflows only).
-
Expiration Time - the time when the workflow will expire (real-time workflows only).
-
Actions - possible actions on the workflow instance:
-
Cancel (x) - cancels the workflow instance. The workflow instance goes to state FAILED.ABORTED.
-
Suspend (||) - suspends a running workflow instance. (This does not work for real-time workflows.)
-
Resume (>) - resumes a suspended workflow instance. (This does not work for real-time workflows.)
Use the Change filter button to display the filter specification area and search for other workflow instances. (See the section "Using the Filter" for details.)
You can sort the result table by clicking on a column heading.
Click on a list item to display workflow instance details. (See the section "Workflow Details".)
Note that real-time workflow items are only visible while they are running.
Workflow Details
The workflow details are displayed below the result table. The following information is provided:
-
Name - the workflow display name.
-
Path - the path to the workflow definition.
-
State - the state of the workflow.
-
Start Time - the start time of the workflow.
-
End Time - the time when the workflow finished.
-
Expiration Time - the expiration time of this workflow instance.
Activities
A table that contains all activities of this workflow. The columns are:
-
Name - the name of the activity.
-
State - the state of the activity.
-
Start Time - the start time of the activity.
-
End Time - the time when this activity finished.
-
Resourcefamily - the resource family of this activity.Note that for request workflows, workflowengine is always displayed.
-
Retries - the number of retries already performed and the last retry time.
-
Schedule - the schedule that started this workflow, if any.
-
Assigned Worker - the assigned worker, if any.
Use Hide details to hide the workflow details.
Monitoring a Java-based Server with a JMX Application
Java Management Extensions (JMX) is a Java technology that supplies tools for managing and monitoring applications, system objects and service-oriented networks.These resources are represented by objects called MBeans (for Managed Bean).You can use any JMX-enabled client to control the Java-based Server or the Apache ActiveMQ Message Broker.
Note: The C++-based Server is not yet JMX-enabled.
One possible selection is Jconsole from a Java JDK.In this case:
Start the console.
In the dialog box for a New Connection, enter under Remote Process host:_port_ (on a local machine, you can enter localhost and 40005), the username domainadmin in username and the password for the DomainAdmin of the Connectivity store in password.Click connect.Another dialog box is displayed if you are not using SSL.Click Insecure connection.
By default, JMX access for the Java-based Server (IdS-J) is enabled but needs authentication.
Exposed MBeans for JMX Applications
This section describes the MBeans that are available for the Java-based Server.
In general, an MBean object offers:
-
Attributes that can be read (or written)
-
Methods that can be invoked and arguments that can be supplied to them or values returned from them
Every MBean has an object name in the format:
domain: key-property-list
For the Java-based Server, the domain part is com.siemens.idm.
Server
Object Name: com.siemens.idm:type=idsj,topic=core,name=Server
Attribute: State - an integer value that represents the server state ranging from 0 to 10, where 10 is good. Internally, the state represents the current server’s use of heap memory. A value below 4 indicates a server with a high memory load.
Object Name: com.siemens.idm:type=idsj,topic=core,name=Statistics
Attribute: SEVERE - the number of SEVERE messages that occurred.
Attribute: WARNING - the number of WARNING messages that occurred.
A high number indicates connected directories that have been unavailable for a long period or misconfigured workflows, or other severe issues.
Target System-specific Listeners
Object Name: com.siemens.idm:type=idsj,topic= ProvTSListener,name=queueType.type.cluster.resource
where queueType is provisiontots, setpasswordrequest or workflow.provisiontots
and type.cluster.resource is taken from the corresponding attributes of the target system.
Attributes:
name - the queue name the adapter is listening to.
messagesReceived - the number of messages received.
messagesSucceeded - the number of messages that were processed successfully.
messagesRedelivered - the number of received messages that were re-delivered; that is, they were processed before but failed temporarily.
messagesFailedTemporary - the number of messages that could not be processed successfully and were re-delivered with a delay.
messagesFailedFinal - the number of messages that could not be processed successfully and where a retry was not possible; for example, because the maximum number of retries was reached.
Adaptors
Object Name: com.siemens.idm:type=idsj,topic=adaptor,name=AdaptorName
where AdaptorName is, for example, ProvisioningRequestListener, EntryChangeListener, DeadLetterQueue, and so on.
Attribute:*state* - the adaptor’s state: listening, waiting, or suspended.
Attribute: outstandingResponses - the number of current outstanding responses for sent requests received from processing workflows. This field indicates the number of events that are not yet finished. A high number indicates a heavy load. If the value reaches the high watermark, the adaptor enters the waiting state. Note that this is not a real warning case as the server will process these requests and will reconnect to the message broker when the low watermark is reached and will retrieve further requests. Only if the number is constantly high for a very long period should the situation be considered a warning.
Attribute: entryCount - a special attribute for the DeadLetterQueue (DLQ): the number of stored events that could not be successfully processed. A high number indicates connected directories that have been unavailable for a long period, misconfigured workflows or other severe issues.
Attribute: highWater - the high watermark value.
Attribute: lowWater - the low watermark value.
Dispatchers
Object Name: com.siemens.idm:type=idsj,topic= ProvMsgDispatcher,name= queueType
where queueType is provisiontots, setpasswordrequest, or workflow.provisiontots.
Attributes:
name - the queue name the dispatcher is listening to.
messagesReceived - the number of messages received.
messagesFailed - the number of messages that could not be forwarded to either the default queue or the target system-specific queue.
Resolution Adapter
Object Name: com.siemens.idm:type=server.extension.adapter,name=resolutionAdapter
Attributes:
JmsConnectionStarted - whether the adapter is currently connected to the Message Broker.
JmsConnectionStarts - how often the adapter has started a JMS connection.
JmsExceptions - how many exceptions have been received from the Message Broker. Such an exception typically means that the JMS connection was lost.
JmsRebinds - how often the adapter has tried to re-bind to the Message Broker after the connection was lost.
MessagesReceived - the total number of messages that have been received.
MessagesSucceeded - how many messages have been processed successfully and resolved the user.
MessagesRedelivered - how many messages have been re-delivered due to failure.
MessagesFailedTemporary - how many messages have failed temporarily. When a failure is considered to be temporary, the adapter tries to re-deliver it to process it after the retry time has expired.
MessagesFailedFinal - how many messages have failed finally. A message fails finally if the error is not temporary or the maximum number of retries has been reached.
MessagesIgnored - how many of the received messages have been ignored. A message is ignored if the user has already been resolved after the change that this message represents. Note that the message contains the time of change. The adapter adds a grace period to cope with potential time differences at client and server.
Realtime Workflows
For each realtime workflow that has run at least once, an object is created with the full workflow name; for example, Ident_Extranet_Realtime from the My-Company scenario:
Object Name: com.siemens.idm:type=idsj,topic=core,name=Statistics,
name0=My-Company,name1=Main,name2=Target Realtime,name3=Extranet Portal,
name4=Ident_Extranet_Realtime
Attribute: START - the number of workflow runs.
Attribute: SUCCEEDED - the number of succeeded workflow runs. The difference of these 2 values contains failed or running workflows.
Attribute: WARNING - the number of workflows with warnings.
Attributes: join.ModifyFailed, join.AddFailed, join.DeleteFailed, join.SearchFailed – each value represents the number of failed request operations. These numbers should be zero or small.
Request Workflows
For each request workflow that has run at least once, an object is created with the full workflow name; for example, Manager Nomination from the My-Company scenario:
Object Name: com.siemens.idm:type=idsj,topic=core,name=Statistics,name0=confdb,
name1=workflow,name2=Definitions,name3=My-Company,name4=Approval,
name5=Manager Nomination
Attribute: START - the number of workflow runs.
Attribute: SUCCEEDED - the number of succeeded workflow runs. The difference of these two values contains failed or running workflows.
Attribute: FAILED - the number of failed workflow runs.
Attribute: Apply Changes.SUCCEEDED - the number of succeeded Apply Changes activity runs.
|
General Note:
Not every attribute described here is always present. For example, if none of the processed request workflow runs has failed, then the attribute FAILED is not present.
|